Lebanon: Fire Incidents, Kentucky (KY)
Where are fire incidents reported in Lebanon, KY
Something went wrong! Please refresh the page.
|
| |||||||||||||||||||||||||||||||||||||||||||||||||||||||||||||||||||||||||||||||||||||||||||||||||||||||||||||
2003 - 2018 National Fire Incident Reporting System (NFIRS) incidents
- Incident types reported to NFIRS in Lebanon, KY
- 12979.6%Fire
- 1811.1%Hazardous Condition
- 53.1%Rescue & EMS
- 53.1%Good Intent Call
- 21.2%Service Call
- 21.2%False Alarm
- 10.6%Severe Weather
- Fire incident types reported to NFIRS in Lebanon, KY
- 6751.9%Structure Fires
- 3023.3%Outside Fires
- 1612.4%Mobile Property/Vehicle Fires
- 1612.4%Other
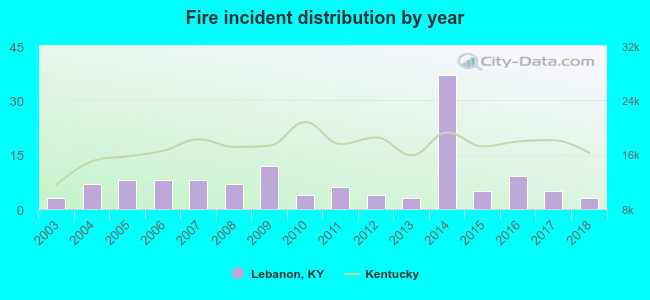 According to the data from the years 2003 - 2018 the average number of fire incidents per year is 8. The highest number of reported fires - 37 took place in 2014, and the least - 3 in 2003. The data has a constant trend.
The average number of yearly fire incidents per 10k residents in Lebanon, KY compared to nearest cities:
(Note: Based on data for the last 3 years, including only cities with population 5,000 and above)
| Lebanon: | 10.1 |
| Campbellsville: | 62.0 |
| Bardstown: | 41.5 |
| Coxs Creek: | 7.1 |
| Harrodsburg: | 106.4 |
| Danville: | 54.6 |
| Elizabethtown: | 49.7 |
| Waynesburg: | 64.9 |
| Lawrenceburg: | 40.6 |

 30.2% incidents where reported in the morning and 69.8% in the evening. The most fires (17.8%) took place on Tuesday, and the least (10.1%) on Friday.
 Based on the 129 incident reports from years 2003 - 2018 most fires (24.8%) took place during January, and the least (2.3%) in July.
 Out of all 162 cases reported during the years 2003 - 2018, the most belonged to the categories: Fire (79.6%), Rescue & EMS (11.1%), and Overpressure Rupture (3.1%).
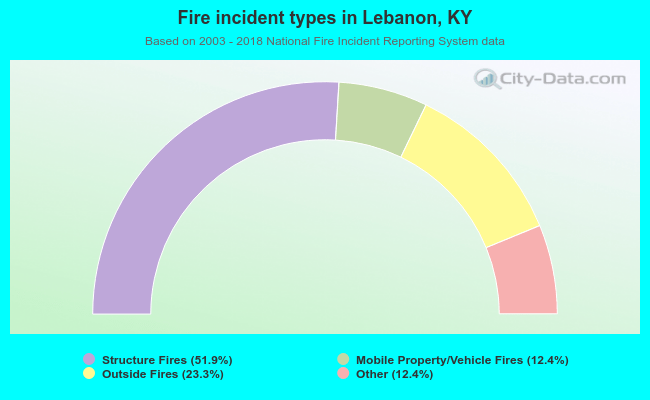 When looking into fire subcategories, the most incidents belonged to: Structure Fires (51.9%), and Outside Fires (23.3%).