Delhi: Fire Incidents, Louisiana (LA)
Where are fire incidents reported in Delhi, LA
Something went wrong! Please refresh the page.
|
| |||||||||||||||||||||||||||||||||||||||||||||||||||||||||||||||||||||||||||||||||||||||||||||||||||||||||||||
| Other | 90 | |||||||||||||||||||||||||||||||||||||||||||||||||||||||||||||||||||||||||||||||||||||||||||||||||||||||||||||
2002 - 2018 National Fire Incident Reporting System (NFIRS) incidents
- Incident types reported to NFIRS in Delhi, LA
- 61071.8%Fire
- 758.8%Rescue & EMS
- 505.9%Hazardous Condition
- 414.8%Good Intent Call
- 404.7%False Alarm
- 192.2%Service Call
- 91.1%Overpressure Rupture
- 50.6%Severe Weather
- Fire incident types reported to NFIRS in Delhi, LA
- 28045.9%Outside Fires
- 19632.1%Structure Fires
- 10216.7%Mobile Property/Vehicle Fires
- 325.2%Other
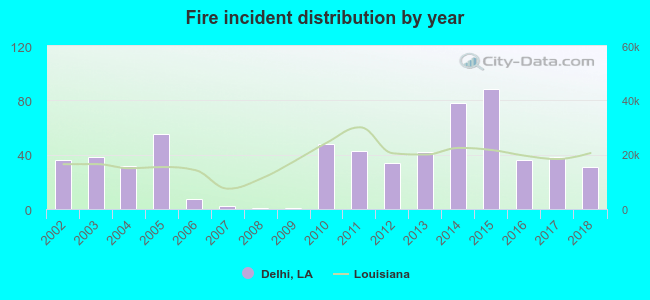 Based on the data from the years 2002 - 2018 the average number of fires per year is 36. The highest number of reported fire incidents - 88 took place in 2015, and the least - 1 in 2008. The data has a dropping trend.
 The median response time based on all reported fire incidents is 8 minutes. This is higher compared to the Louisiana median value.
The median response time in Delhi, LA compared to nearest cities:
(Note: Based on data for all years, including only cities with at least 500 fire incidents)
| Delhi: | 8 minutes |
| Rayville: | 5 minutes |
| Tallulah: | 4 minutes |
| Winnsboro: | 6 minutes |
| Oak Grove: | 10 minutes |
| Bastrop: | 4 minutes |
| Monroe: | 5 minutes |
| West Monroe: | 6 minutes |
| Eudora: | 10 minutes |
 26.9% incidents where reported in the morning and 73.1% in the evening. The most fires (15.9%) took place on Sunday, and the least (13.0%) on Friday.
 According to the 610 incident reports from years 2002 - 2018 most fires (11.5%) took place during September, and the least (4.8%) in April.
 Out of all 849 cases reported during the years 2002 - 2018, the most belonged to the categories: Fire (71.8%), Rescue & EMS (8.8%), and Hazardous Condition (5.9%).
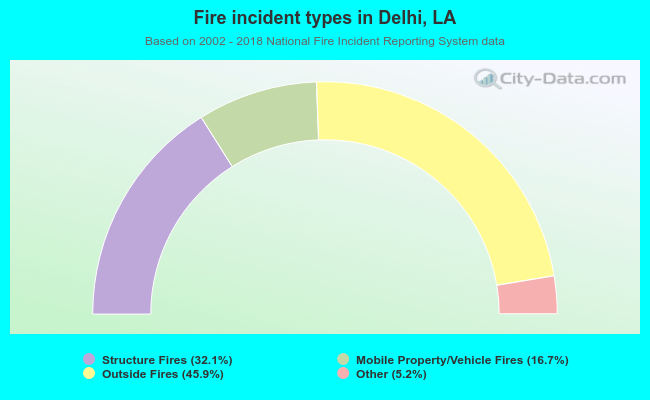 When looking into fire subcategories, the most reports belonged to: Outside Fires (45.9%), and Structure Fires (32.1%).