Monroe: Fire Incidents, Louisiana (LA)
Where are fire incidents reported in Monroe, LA
Something went wrong! Please refresh the page.
| Fire incidents reported | |
|---|---|
| Sreet name | Count |
| DESIARD ST | 276 |
| WINNSBORO RD | 274 |
| HIGHWAY 139 | 202 |
| PRAIRIE RD | 196 |
| LOUISVILLE AVE | 180 |
| JACKSON ST | 152 |
| US HIGHWAY 165 | 142 |
| GRAND ST | 126 |
| OLD STERLINGTON RD | 126 |
| LEE AVE | 110 |
| STERLINGTON RD | 110 |
| RICHWOOD ROAD NO 2 | 106 |
| GARRETT RD | 104 |
| HIGHWAY 165 | 100 |
| 3RD ST | 96 |
| DELLWOOD DR | 96 |
| HIGHWAY 134 | 96 |
| FINKS HIDEAWAY RD | 90 |
| HIGHWAY 594 | 88 |
| HIGHWAY 165 BYPASS | 86 |
| MILLHAVEN RD | 86 |
| PEACH ST | 86 |
| GORDON AVE | 84 |
| ELM ST | 82 |
| RICHWOOD #2 RD | 82 |
| TICHELI RD | 74 |
| 18TH ST | 72 |
| MCKEEN PL | 72 |
| BURG JONES LN | 70 |
| ROWLAND RD | 70 |
| Other | 3,898 |
2002 - 2018 National Fire Incident Reporting System (NFIRS) incidents
- Incident types reported to NFIRS in Monroe, LA
- 19,51544.0%Rescue & EMS
- 7,43216.8%Fire
- 7,38516.7%Good Intent Call
- 4,3649.8%Service Call
- 3,1617.1%False Alarm
- 2,3705.3%Hazardous Condition
- 470.1%Overpressure Rupture
- Fire incident types reported to NFIRS in Monroe, LA
- 2,97540.0%Outside Fires
- 2,73236.8%Structure Fires
- 1,26117.0%Mobile Property/Vehicle Fires
- 4646.2%Other
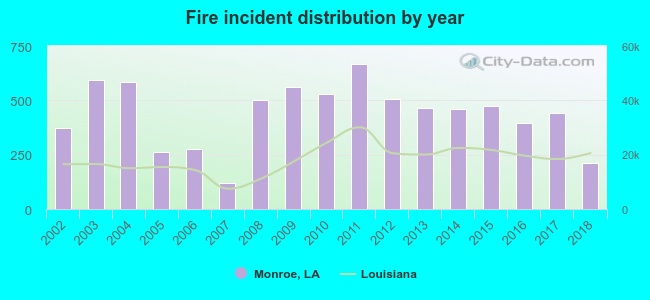 Based on the data from the years 2002 - 2018 the average number of fires per year is 437. The highest number of reported fires - 668 took place in 2011, and the least - 120 in 2007. The data has a dropping trend.
The average number of yearly fire incidents per 10k residents in Monroe, LA compared to nearest cities:
(Note: Based on data for the last 3 years, including only cities with population 5,000 and above)
| Monroe: | 70.4 |
| West Monroe: | 210.8 |
| Bastrop: | 126.2 |
| Ruston: | 42.6 |
| Grambling: | 33.8 |
| Tallulah: | 201.0 |
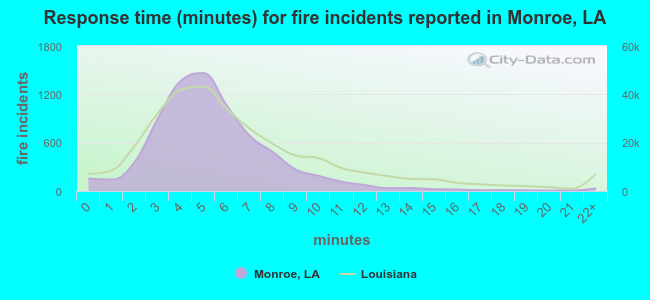 The median response time based on all reported fire incidents is 5 minutes. This is lower compared to the state median value.
The median response time in Monroe, LA compared to nearest cities:
(Note: Based on data for all years, including only cities with at least 500 fire incidents)
| Monroe: | 5 minutes |
| West Monroe: | 6 minutes |
| Calhoun: | 7 minutes |
| Rayville: | 5 minutes |
| Bastrop: | 4 minutes |
| Choudrant: | 8 minutes |
| Farmerville: | 7 minutes |
| Ruston: | 6 minutes |
| Winnsboro: | 6 minutes |
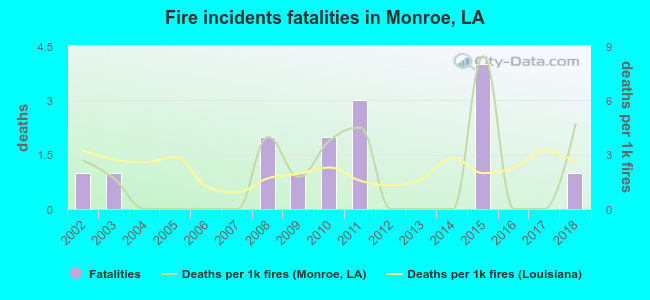 Based on the reports from the years 2002 - 2018 the average number of fire-related yearly deaths is 1. The highest number of deaths - 4 took place in 2015, and the lowest - 0 in 2004. The data has a constant trend.
The average number of fatalities per 1,000 fires is 2. This indicator was the highest - 8 in 2015, and the lowest 0 in 2004. The trend for fatalities per 1,000 incidents is increasing. Compared to the state value the number of deaths per 1,000 fire incidents is about the same.
Based on the reports from the years 2002 - 2018 the average number of fire-related yearly deaths is 1. The highest number of deaths - 4 took place in 2015, and the lowest - 0 in 2004. The data has a constant trend.
The average number of fatalities per 1,000 fires is 2. This indicator was the highest - 8 in 2015, and the lowest 0 in 2004. The trend for fatalities per 1,000 incidents is increasing. Compared to the state value the number of deaths per 1,000 fire incidents is about the same.Deaths per 1,000 incidents in Monroe, LA compared to nearest cities:
(Note: Based on data for all years, including only cities with at least 2,500 fire incidents)
| Monroe: | 2.0 |
| West Monroe: | 2.7 |
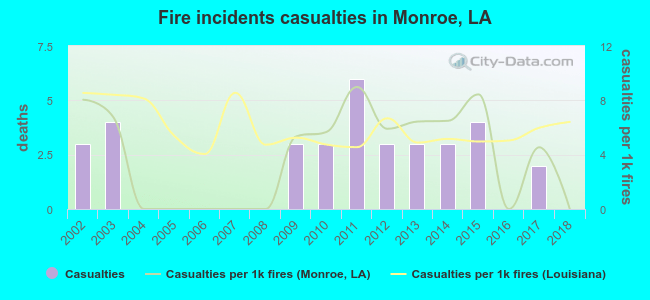 Based on the reports from the years 2002 - 2018 the average number of fire-related casualties per year is 2. The highest number of casualties - 6 took place in 2011, and the lowest - 0 in 2004. The data has a declining trend.
The average number of injuries per 1,000 fire incidents is 4. This indicator was the highest - 9 in 2011, and the lowest 0 in 2004. The trend for injuries per 1,000 fires is dropping. Compared to the Louisiana value the number of casualties per 1,000 fire incidents is lower.
Based on the reports from the years 2002 - 2018 the average number of fire-related casualties per year is 2. The highest number of casualties - 6 took place in 2011, and the lowest - 0 in 2004. The data has a declining trend.
The average number of injuries per 1,000 fire incidents is 4. This indicator was the highest - 9 in 2011, and the lowest 0 in 2004. The trend for injuries per 1,000 fires is dropping. Compared to the Louisiana value the number of casualties per 1,000 fire incidents is lower.Casualties per 1,000 incidents in Monroe, LA compared to nearest cities:
(Note: Based on data for all years, including only cities with at least 500 fire incidents)
| Monroe: | 4.6 |
| West Monroe: | 4.6 |
| Calhoun: | 10.8 |
| Rayville: | 3.3 |
| Bastrop: | 1.0 |
| Choudrant: | 1.7 |
| Farmerville: | 4.7 |
| Ruston: | 8.9 |
| Winnsboro: | 0.0 |
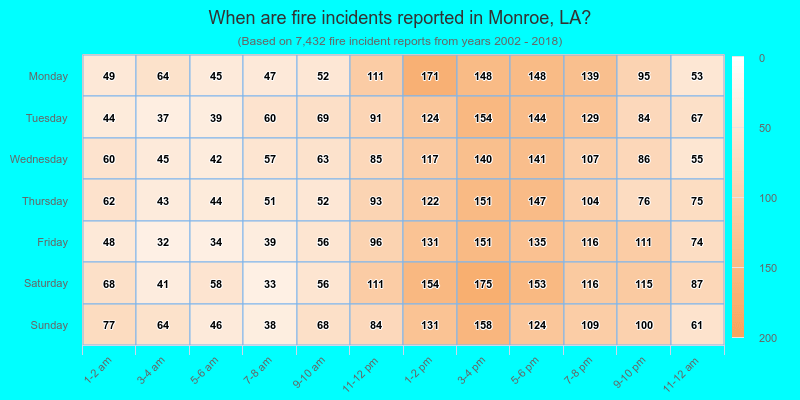
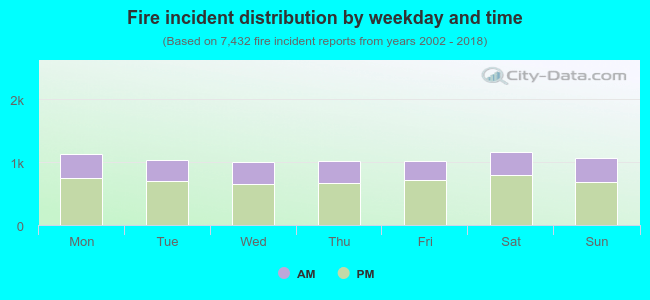 33.0% incidents where reported in the morning and 67.0% in the evening. The most fires (15.7%) took place on Saturday, and the least (13.4%) on Wednesday.
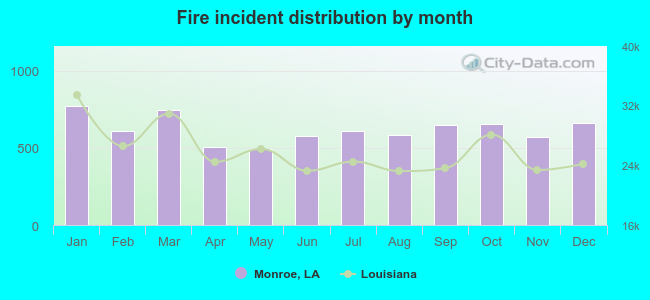 Based on the 7,432 fires from years 2002 - 2018 most fires (10.4%) took place during January, and the least (6.6%) in May.
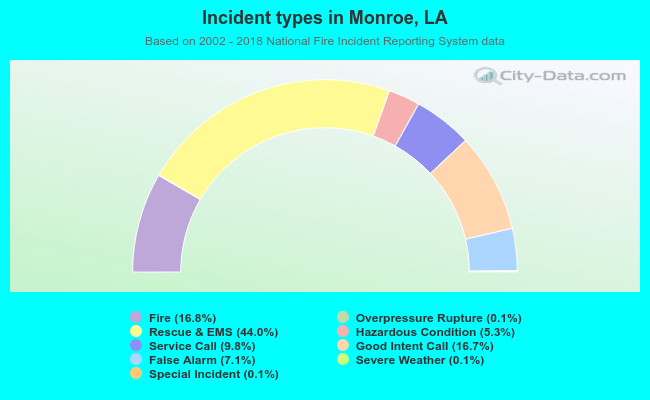 Out of all 44,350 cases reported during the years 2002 - 2018, the most belonged to the categories: Rescue & EMS (44.0%), Fire (16.8%), and Good Intent Call (16.7%).
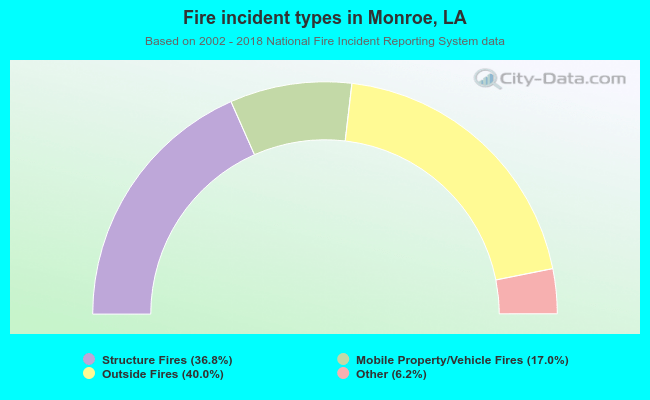 When looking into fire subcategories, the most incidents belonged to: Outside Fires (40.0%), and Structure Fires (36.8%).