Downers Grove: Fire Incidents, Illinois (IL)
Where are fire incidents reported in Downers Grove, IL
Something went wrong! Please refresh the page.
| Fire incidents reported | |
|---|---|
| Sreet name | Count |
| BUTTERFIELD RD | 112 |
| MAIN | 92 |
| OGDEN AV | 92 |
| PRENTISS DR | 80 |
| 75TH | 66 |
| LEMONT RD | 62 |
| FINLEY RD | 58 |
| BELMONT RD | 54 |
| FAIRVIEW AV | 54 |
| MAPLE AV | 40 |
| OGDEN | 40 |
| CURTISS | 38 |
| WASHINGTON | 38 |
| DUNHAM RD | 34 |
| 75TH ST | 32 |
| FAIRVIEW | 32 |
| HIGHLAND AV | 32 |
| MAIN ST | 32 |
| I355 | 26 |
| WOODWARD AVE | 26 |
| 63RD | 24 |
| CONCORD DR | 24 |
| REDONDO DR | 24 |
| WASHINGTON ST | 22 |
| WOODWARD AV | 22 |
| 31ST | 20 |
| CHICAGO AV | 20 |
| FAIRMOUNT AV | 20 |
| WARREN AV | 20 |
| MAPLE AVE | 18 |
| Other | 298 |
2002 - 2018 National Fire Incident Reporting System (NFIRS) incidents
- Incident types reported to NFIRS in Downers Grove, IL
- 17,75357.1%Rescue & EMS
- 3,95812.7%False Alarm
- 3,32910.7%Service Call
- 2,6858.6%Hazardous Condition
- 1,7325.6%Good Intent Call
- 1,5525.0%Fire
- Fire incident types reported to NFIRS in Downers Grove, IL
- 77449.9%Structure Fires
- 52233.6%Outside Fires
- 19212.4%Mobile Property/Vehicle Fires
- 644.1%Other
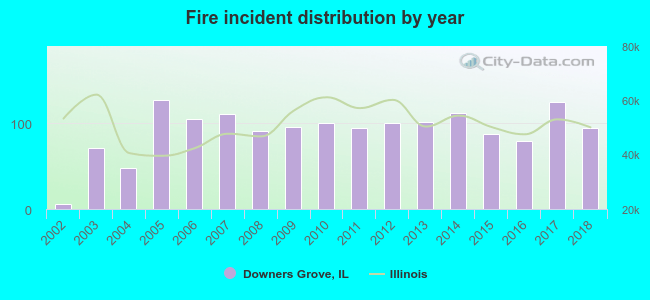 Based on the data from the years 2002 - 2018 the average number of fire incidents per year is 91. The highest number of reported fire incidents - 127 took place in 2005, and the least - 6 in 2002. The data has a growing trend.
The average number of yearly fire incidents per 10k residents in Downers Grove, IL compared to nearest cities:
(Note: Based on data for the last 3 years, including only cities with population 5,000 and above)
| Downers Grove: | 20.0 |
| Westmont: | 22.6 |
| Clarendon Hills: | 17.3 |
| Woodridge: | 20.6 |
| Darien: | 21.1 |
| Willowbrook: | 46.0 |
| Lisle: | 29.1 |
| Hinsdale: | 25.2 |
| Oak Brook: | 71.9 |
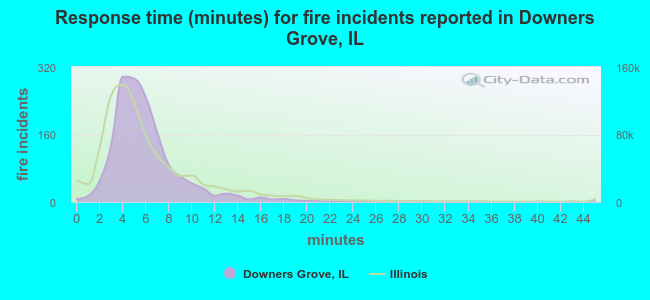 The median response time based on all reported fire incidents is 5 minutes. This is about the same as the state median value.
The median response time in Downers Grove, IL compared to nearest cities:
(Note: Based on data for all years, including only cities with at least 500 fire incidents)
| Downers Grove: | 5 minutes |
| Westmont: | 5 minutes |
| Woodridge: | 5 minutes |
| Darien: | 5 minutes |
| Willowbrook: | 5 minutes |
| Lisle: | 5 minutes |
| Hinsdale: | 5 minutes |
| Oak Brook: | 5 minutes |
| Burr Ridge: | 7 minutes |
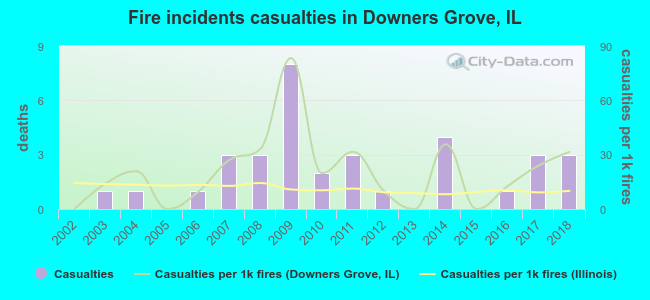 Based on the data from the years 2002 - 2018 the average number of fire-related casualties per year is 2. The highest number of reported injuries - 8 took place in 2009, and the lowest - 0 in 2002. The data has a growing trend.
The average number of casualties per 1,000 fire incidents is 21. This indicator was the highest - 83 in 2009, and the lowest 0 in 2002. The trend for casualties per 1,000 incidents is rising. Compared to the state value the number of casualties per 1,000 incidents is higher.
Based on the data from the years 2002 - 2018 the average number of fire-related casualties per year is 2. The highest number of reported injuries - 8 took place in 2009, and the lowest - 0 in 2002. The data has a growing trend.
The average number of casualties per 1,000 fire incidents is 21. This indicator was the highest - 83 in 2009, and the lowest 0 in 2002. The trend for casualties per 1,000 incidents is rising. Compared to the state value the number of casualties per 1,000 incidents is higher.Casualties per 1,000 incidents in Downers Grove, IL compared to nearest cities:
(Note: Based on data for all years, including only cities with at least 500 fire incidents)
| Downers Grove: | 21.9 |
| Westmont: | 21.2 |
| Woodridge: | 19.9 |
| Darien: | 12.9 |
| Willowbrook: | 14.9 |
| Lisle: | 26.1 |
| Hinsdale: | 15.1 |
| Oak Brook: | 10.9 |
| Burr Ridge: | 14.3 |
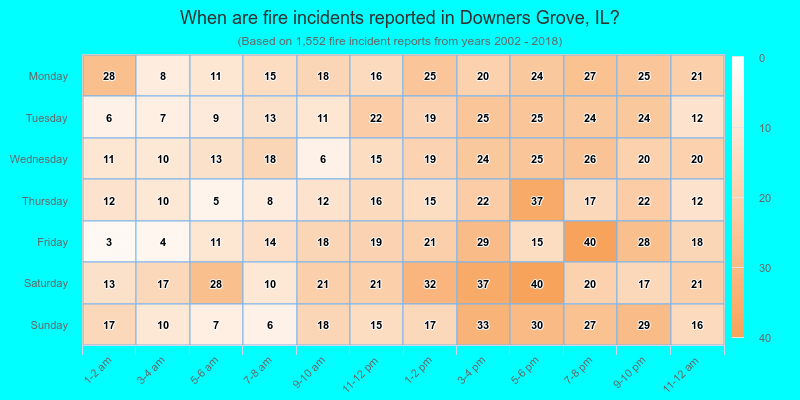
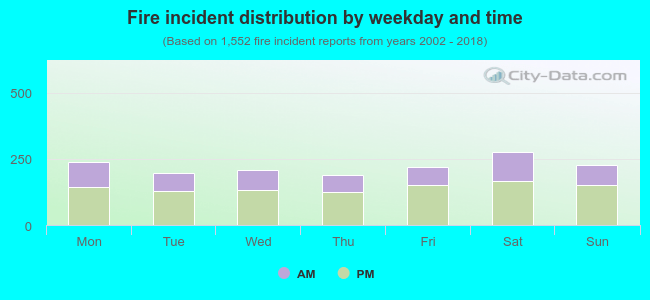 35.6% incidents where reported in the morning and 64.4% in the evening. The most fires (17.8%) took place on Saturday, and the least (12.1%) on Thursday.
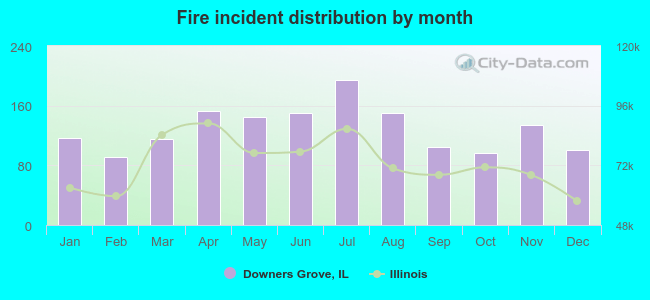 According to the 1,552 reports from years 2002 - 2018 most fires (12.6%) took place during July, and the least (5.9%) in February.
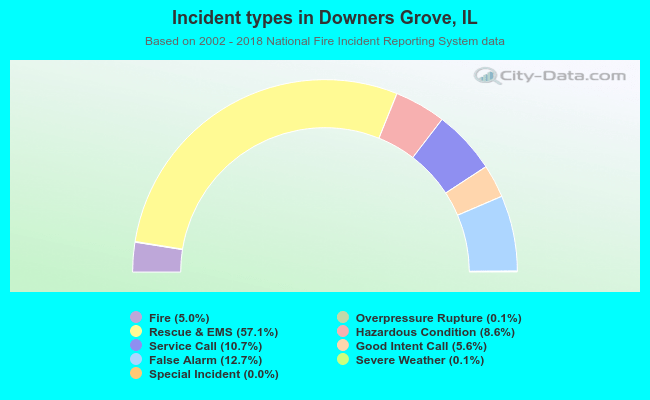 Out of all 31,072 cases reported during the years 2002 - 2018, the most belonged to the categories: Rescue & EMS (57.1%), False Alarm (12.7%), and Service Call (10.7%).
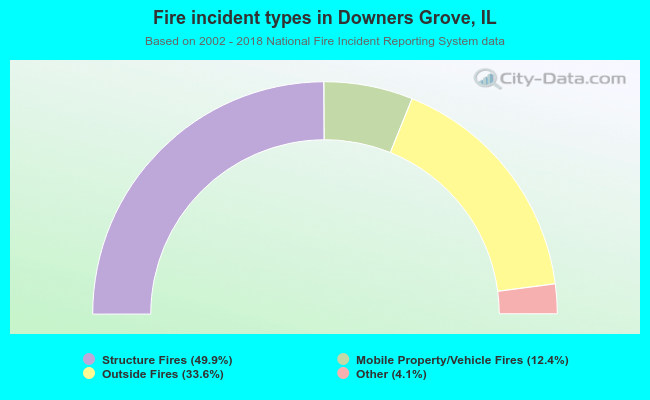 When looking into fire subcategories, the most incidents belonged to: Structure Fires (49.9%), and Outside Fires (33.6%).