Woodridge: Fire Incidents, Illinois (IL)
Where are fire incidents reported in Woodridge, IL
Something went wrong! Please refresh the page.
| Fire incidents reported | |
|---|---|
| Sreet name | Count |
| WOODWARD AVE | 208 |
| 75TH ST | 108 |
| JANES AV | 58 |
| WOODRIDGE DR | 50 |
| WATERBURY DR | 48 |
| 83RD ST | 40 |
| 63RD ST | 34 |
| 71ST ST | 34 |
| LEMONT RD | 32 |
| DOUBLE EAGLE DR | 28 |
| COUNTRY CLUB DR | 26 |
| ORCHARD LN | 26 |
| DAVEY RD | 24 |
| MEADOWDALE LN | 24 |
| RT 53 | 24 |
| MITCHELL DR | 22 |
| WOODWARD AV | 22 |
| FOREST DR | 20 |
| WOODWARD | 20 |
| 87TH ST | 18 |
| RIDGE LN | 18 |
| BRUNSWICK CIR | 16 |
| EMERALD CT | 16 |
| LARCHWOOD LN | 16 |
| ROBERTS DR | 16 |
| ROUTE 53 | 16 |
| APPLE LN | 14 |
| DAVID DR | 14 |
| GLADSTONE DR | 14 |
| HOBSON RD | 14 |
| Other | 88 |
2003 - 2018 National Fire Incident Reporting System (NFIRS) incidents
- Incident types reported to NFIRS in Woodridge, IL
- 8,38350.3%Rescue & EMS
- 3,46620.8%False Alarm
- 1,5839.5%Hazardous Condition
- 1,1827.1%Service Call
- 1,1086.6%Fire
- 9225.5%Good Intent Call
- Fire incident types reported to NFIRS in Woodridge, IL
- 47743.1%Structure Fires
- 38835.0%Outside Fires
- 18016.2%Mobile Property/Vehicle Fires
- 635.7%Other
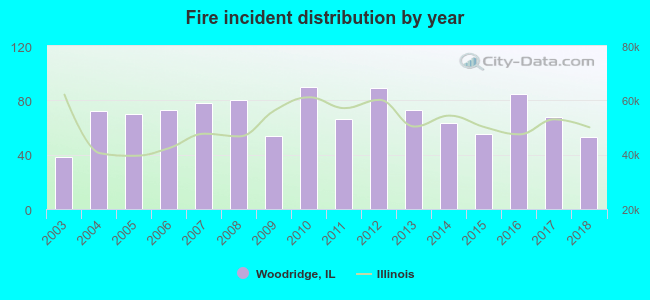 According to the data from the years 2003 - 2018 the average number of fire incidents per year is 69. The highest number of fire incidents - 90 took place in 2010, and the least - 38 in 2003. The data has a growing trend.
The average number of yearly fire incidents per 10k residents in Woodridge, IL compared to nearest cities:
(Note: Based on data for the last 3 years, including only cities with population 5,000 and above)
| Woodridge: | 20.6 |
| Darien: | 21.1 |
| Downers Grove: | 20.0 |
| Bolingbrook: | 23.8 |
| Lisle: | 29.1 |
| Westmont: | 22.6 |
| Willowbrook: | 46.0 |
| Clarendon Hills: | 17.3 |
| Naperville: | 16.1 |
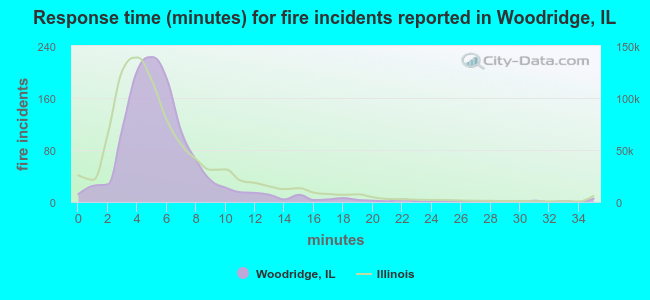 The median response time based on all reported fire incidents is 5 minutes. This is about the same as the Illinois median value.
The median response time in Woodridge, IL compared to nearest cities:
(Note: Based on data for all years, including only cities with at least 500 fire incidents)
| Woodridge: | 5 minutes |
| Darien: | 5 minutes |
| Downers Grove: | 5 minutes |
| Bolingbrook: | 5 minutes |
| Lisle: | 5 minutes |
| Westmont: | 5 minutes |
| Willowbrook: | 5 minutes |
| Naperville: | 5 minutes |
| Lemont: | 7 minutes |
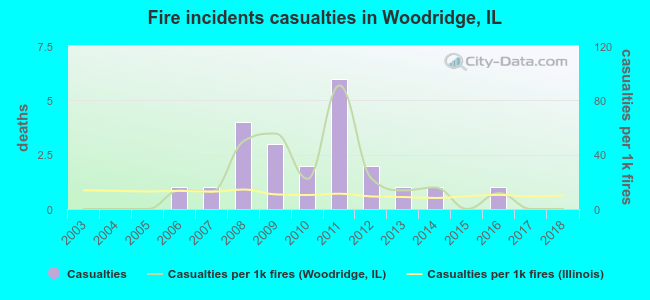 Based on the reports from the years 2003 - 2018 the average number of fire-related yearly casualties is 1. The highest number of casualties - 6 took place in 2011, and the lowest - 0 in 2003. The data has a constant trend.
The average number of injuries per 1,000 fires is 19. This indicator was the highest - 91 in 2011, and the lowest 0 in 2003. The trend for injuries per 1,000 incidents is constant. Compared to the Illinois value the number of casualties per 1,000 incidents is higher.
Based on the reports from the years 2003 - 2018 the average number of fire-related yearly casualties is 1. The highest number of casualties - 6 took place in 2011, and the lowest - 0 in 2003. The data has a constant trend.
The average number of injuries per 1,000 fires is 19. This indicator was the highest - 91 in 2011, and the lowest 0 in 2003. The trend for injuries per 1,000 incidents is constant. Compared to the Illinois value the number of casualties per 1,000 incidents is higher.Casualties per 1,000 incidents in Woodridge, IL compared to nearest cities:
(Note: Based on data for all years, including only cities with at least 500 fire incidents)
| Woodridge: | 19.9 |
| Darien: | 12.9 |
| Downers Grove: | 21.9 |
| Bolingbrook: | 20.8 |
| Lisle: | 26.1 |
| Westmont: | 21.2 |
| Willowbrook: | 14.9 |
| Naperville: | 23.5 |
| Lemont: | 8.4 |
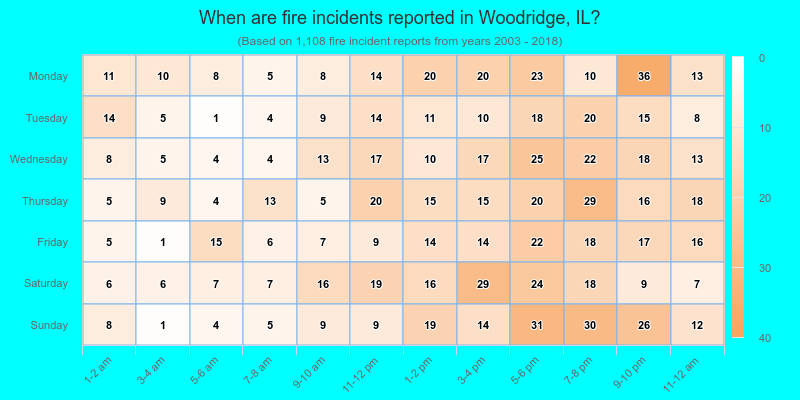
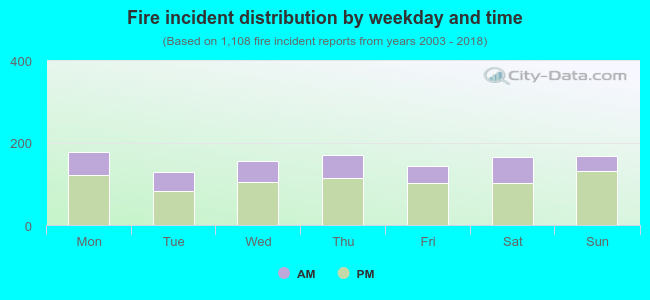 31.6% incidents where reported in the morning and 68.4% in the evening. The most fires (16.1%) took place on Monday, and the least (11.6%) on Tuesday.
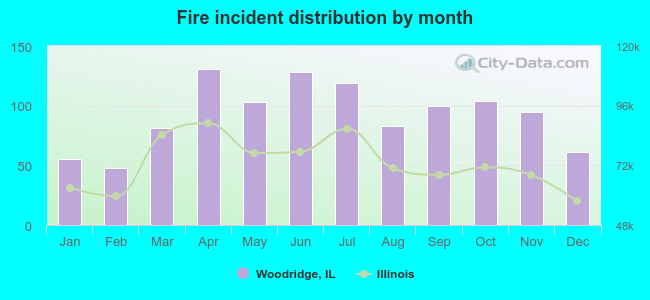 Based on the 1,108 fire incidents from years 2003 - 2018 most fires (11.8%) took place during April, and the least (4.3%) in February.
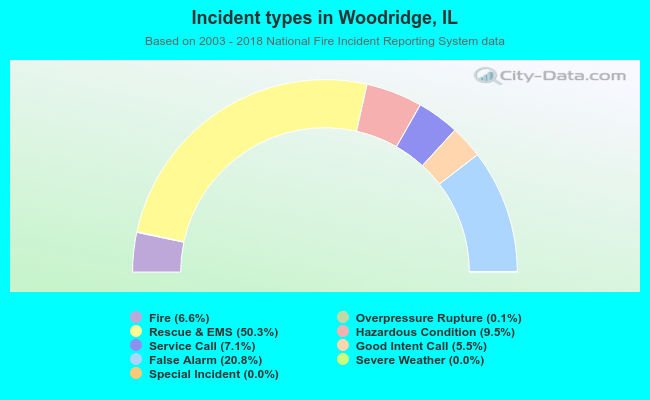 Out of all 16,669 cases reported during the years 2003 - 2018, the most belonged to the categories: Rescue & EMS (50.3%), False Alarm (20.8%), and Hazardous Condition (9.5%).
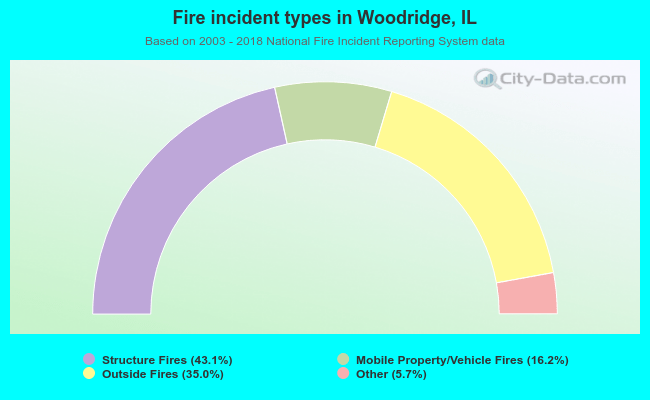 When looking into fire subcategories, the most incidents belonged to: Structure Fires (43.1%), and Outside Fires (35.0%).