Elk Grove Village: Fire Incidents, Illinois (IL)
Where are fire incidents reported in Elk Grove Village, IL
Something went wrong! Please refresh the page.
| Fire incidents reported | |
|---|---|
| Sreet name | Count |
| BIESTERFIELD RD | 150 |
| BUSSE RD | 112 |
| CHARLELA LN | 84 |
| DEVON AV | 84 |
| LANDMEIER RD | 82 |
| MEACHAM RD | 70 |
| PERRIE DR | 60 |
| OAKTON ST | 54 |
| ARLINGTON HEIGHTS RD | 52 |
| PRATT | 48 |
| PRATT BLV | 36 |
| PRATT BLVD | 36 |
| TOUHY AV | 36 |
| HIGGINS | 34 |
| I-290 | 34 |
| HIGGINS RD | 32 |
| RIDGE SQ | 32 |
| WELLINGTON AV | 32 |
| DEVON | 30 |
| NERGE RD | 30 |
| NB 53 | 28 |
| BIESTERFIELD RD | 26 |
| LUNT | 26 |
| ELMHURST RD | 24 |
| GREENLEAF AV | 24 |
| BUSSE WOODS RD | 22 |
| CHASE AV | 22 |
| LUNT AV | 22 |
| TOUHY | 22 |
| UNITED LN | 22 |
| Other | 330 |
2003 - 2018 National Fire Incident Reporting System (NFIRS) incidents
- Incident types reported to NFIRS in Elk Grove Village, IL
- 15,32957.7%Rescue & EMS
- 3,14411.8%False Alarm
- 2,72310.2%Hazardous Condition
- 2,0607.7%Service Call
- 1,6966.4%Fire
- 1,5755.9%Good Intent Call
- 440.2%Overpressure Rupture
- Fire incident types reported to NFIRS in Elk Grove Village, IL
- 88752.3%Structure Fires
- 50129.5%Outside Fires
- 28116.6%Mobile Property/Vehicle Fires
- 271.6%Other
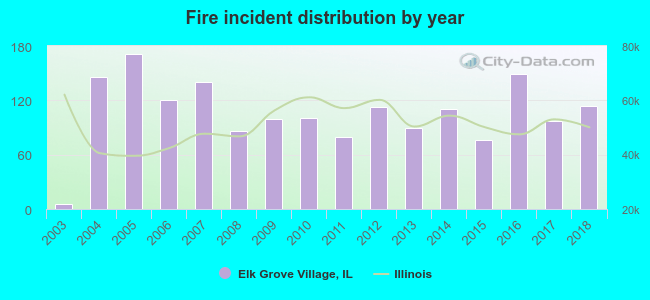 According to the data from the years 2003 - 2018 the average number of fire incidents per year is 106. The highest number of fire incidents - 171 took place in 2005, and the least - 6 in 2003. The data has a rising trend.
The average number of yearly fire incidents per 10k residents in Elk Grove Village, IL compared to nearest cities:
(Note: Based on data for the last 3 years, including only cities with population 5,000 and above)
| Elk Grove Village: | 36.0 |
| Itasca: | 53.8 |
| Wood Dale: | 30.6 |
| Bensenville: | 55.9 |
| Roselle: | 37.8 |
| Addison: | 33.4 |
| Schaumburg: | 18.3 |
| Rolling Meadows: | 23.9 |
| Mount Prospect: | 18.4 |
 The median response time based on all reported fire incidents is 5 minutes. This is comparable to the state median value.
The median response time in Elk Grove Village, IL compared to nearest cities:
(Note: Based on data for all years, including only cities with at least 500 fire incidents)
| Elk Grove Village: | 5 minutes |
| Itasca: | 6 minutes |
| Wood Dale: | 5 minutes |
| Bensenville: | 6 minutes |
| Roselle: | 6 minutes |
| Addison: | 5 minutes |
| Schaumburg: | 5 minutes |
| Rolling Meadows: | 5 minutes |
| Mount Prospect: | 5 minutes |
 Based on the reports from the years 2003 - 2018 the average number of fire-related casualties per year is 2. The highest number of reported casualties - 5 took place in 2016, and the lowest - 0 in 2003. The data has a growing trend.
The average number of injuries per 1,000 fires is 13. This indicator was the highest - 38 in 2011, and the lowest 0 in 2003. The trend for casualties per 1,000 incidents is rising. Compared to the Illinois value the number of injuries per 1,000 fires is higher.
Based on the reports from the years 2003 - 2018 the average number of fire-related casualties per year is 2. The highest number of reported casualties - 5 took place in 2016, and the lowest - 0 in 2003. The data has a growing trend.
The average number of injuries per 1,000 fires is 13. This indicator was the highest - 38 in 2011, and the lowest 0 in 2003. The trend for casualties per 1,000 incidents is rising. Compared to the Illinois value the number of injuries per 1,000 fires is higher.Casualties per 1,000 incidents in Elk Grove Village, IL compared to nearest cities:
(Note: Based on data for all years, including only cities with at least 500 fire incidents)
| Elk Grove Village: | 14.2 |
| Itasca: | 13.4 |
| Wood Dale: | 13.0 |
| Bensenville: | 8.9 |
| Roselle: | 12.6 |
| Addison: | 15.0 |
| Schaumburg: | 9.7 |
| Rolling Meadows: | 19.4 |
| Mount Prospect: | 28.0 |
 32.3% incidents where reported in the morning and 67.7% in the evening. The most fires (15.4%) took place on Wednesday, and the least (11.8%) on Sunday.
 According to the 1,696 fires from years 2003 - 2018 most fires (11.4%) took place during June, and the least (5.2%) in December.
 Out of all 26,585 cases reported during the years 2003 - 2018, the most belonged to the categories: Rescue & EMS (57.7%), False Alarm (11.8%), and Hazardous Condition (10.2%).
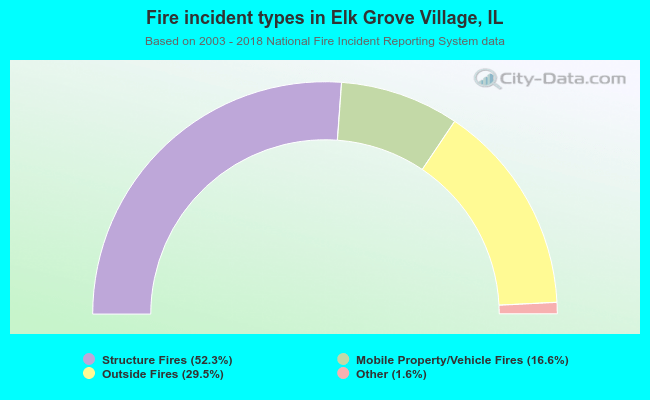 When looking into fire subcategories, the most incidents belonged to: Structure Fires (52.3%), and Outside Fires (29.5%).