Evanston: Fire Incidents, Illinois (IL)
Where are fire incidents reported in Evanston, IL
Something went wrong! Please refresh the page.
| Fire incidents reported | |
|---|---|
| Sreet name | Count |
| CHICAGO AVE | 204 |
| DODGE AVE | 172 |
| SHERIDAN RD | 170 |
| SHERMAN AVE | 154 |
| CENTRAL ST | 130 |
| RIDGE AVE | 130 |
| HINMAN AVE | 120 |
| EMERSON ST | 114 |
| HOWARD ST | 112 |
| DEMPSTER ST | 108 |
| CHURCH ST | 106 |
| MAPLE AVE | 96 |
| OAKTON ST | 92 |
| DAVIS ST | 84 |
| MAIN ST | 82 |
| DEWEY AVE | 78 |
| FOSTER ST | 76 |
| GRANT ST | 76 |
| ASBURY AVE | 74 |
| ORRINGTON AVE | 74 |
| CUSTER AVE | 72 |
| WESLEY AVE | 70 |
| CAMPUS DR | 68 |
| ELMWOOD AVE | 68 |
| ASHLAND AVE | 62 |
| DARROW AVE | 62 |
| GREY AVE | 62 |
| DOBSON ST | 60 |
| OAK AVE | 58 |
| SEWARD ST | 50 |
2002 - 2018 National Fire Incident Reporting System (NFIRS) incidents
- Incident types reported to NFIRS in Evanston, IL
- 32,93759.0%Rescue & EMS
- 7,84914.1%False Alarm
- 6,84912.3%Service Call
- 3,8616.9%Hazardous Condition
- 2,4364.4%Fire
- 1,8053.2%Good Intent Call
- 580.1%Overpressure Rupture
- Fire incident types reported to NFIRS in Evanston, IL
- 1,28852.9%Structure Fires
- 80833.2%Outside Fires
- 30512.5%Mobile Property/Vehicle Fires
- 351.4%Other
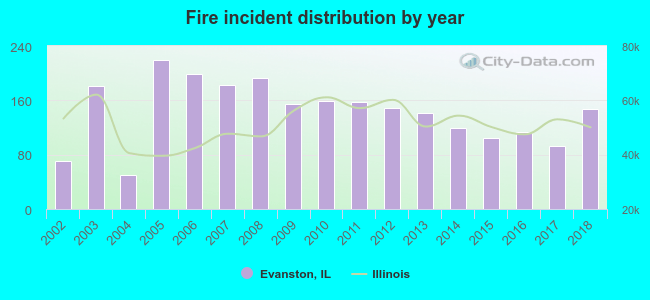 Based on the data from the years 2002 - 2018 the average number of fires per year is 143. The highest number of fire incidents - 220 took place in 2005, and the least - 50 in 2004. The data has an increasing trend.
The average number of yearly fire incidents per 10k residents in Evanston, IL compared to nearest cities:
(Note: Based on data for the last 3 years, including only cities with population 5,000 and above)
| Evanston: | 15.6 |
| Skokie: | 12.6 |
| Wilmette: | 19.7 |
| Lincolnwood: | 16.8 |
| Winnetka: | 20.8 |
| Morton Grove: | 14.8 |
| Northfield: | 21.0 |
| Niles: | 20.0 |
| Glenview: | 16.3 |
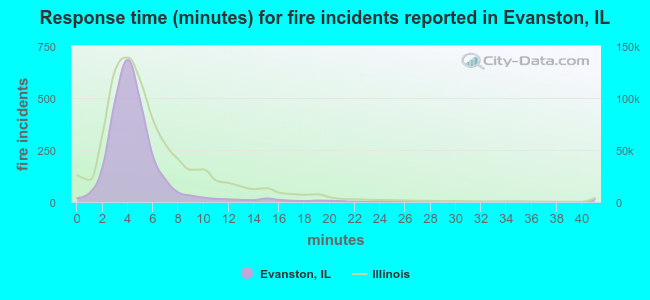 The median response time based on all reported fire incidents is 4 minutes. This is lower compared to the Illinois median value.
The median response time in Evanston, IL compared to nearest cities:
(Note: Based on data for all years, including only cities with at least 500 fire incidents)
| Evanston: | 4 minutes |
| Skokie: | 5 minutes |
| Wilmette: | 4 minutes |
| Lincolnwood: | 4 minutes |
| Winnetka: | 4 minutes |
| Morton Grove: | 4 minutes |
| Niles: | 4 minutes |
| Glenview: | 5 minutes |
| Park Ridge: | 5 minutes |
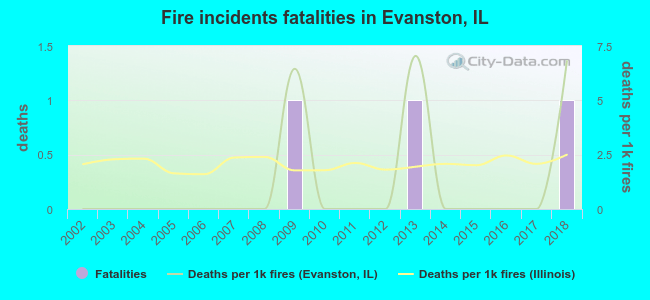 According to the reports from the years 2002 - 2018 the average number of fire-related yearly deaths is 0. The highest number of deaths - 1 took place in 2009, and the lowest - 0 in 2002. The data has an increasing trend.
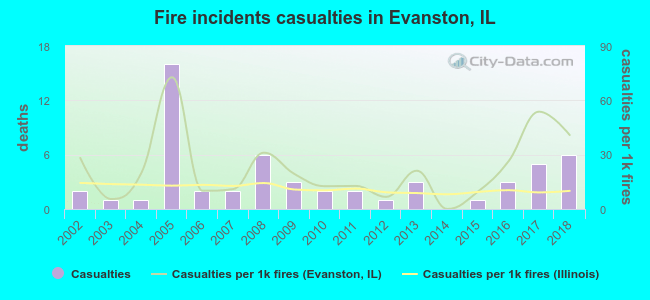 According to the reports from the years 2002 - 2018 the average number of fire-related casualties per year is 3. The highest number of reported casualties - 16 took place in 2005, and the lowest - 0 in 2014. The data has a rising trend.
The average number of casualties per 1,000 fire incidents is 22. This indicator was the highest - 73 in 2005, and the lowest 0 in 2014. The trend for injuries per 1,000 fire incidents is growing. Compared to the state value the number of casualties per 1,000 incidents is much higher.
According to the reports from the years 2002 - 2018 the average number of fire-related casualties per year is 3. The highest number of reported casualties - 16 took place in 2005, and the lowest - 0 in 2014. The data has a rising trend.
The average number of casualties per 1,000 fire incidents is 22. This indicator was the highest - 73 in 2005, and the lowest 0 in 2014. The trend for injuries per 1,000 fire incidents is growing. Compared to the state value the number of casualties per 1,000 incidents is much higher.Casualties per 1,000 incidents in Evanston, IL compared to nearest cities:
(Note: Based on data for all years, including only cities with at least 500 fire incidents)
| Evanston: | 23.0 |
| Skokie: | 21.4 |
| Wilmette: | 5.0 |
| Lincolnwood: | 22.0 |
| Winnetka: | 15.2 |
| Morton Grove: | 3.5 |
| Niles: | 11.2 |
| Glenview: | 17.9 |
| Park Ridge: | 16.8 |
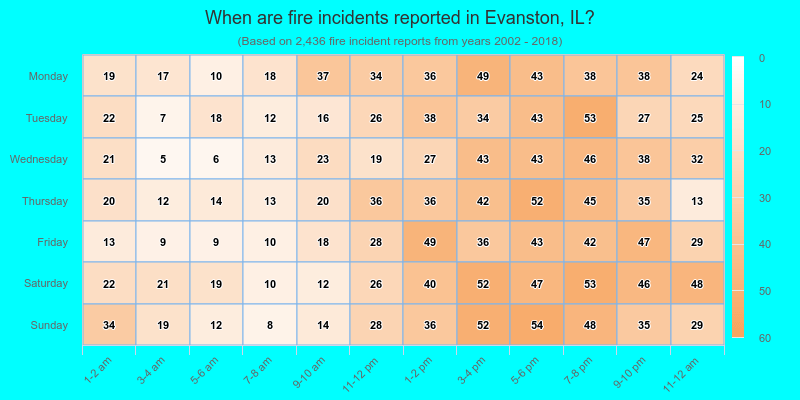
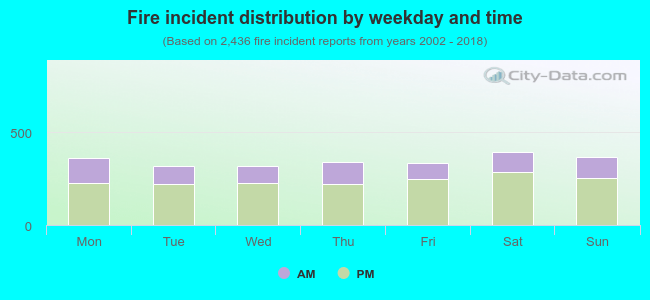 30.8% incidents where reported in the morning and 69.2% in the evening. The most fires (16.3%) took place on Saturday, and the least (13.0%) on Wednesday.
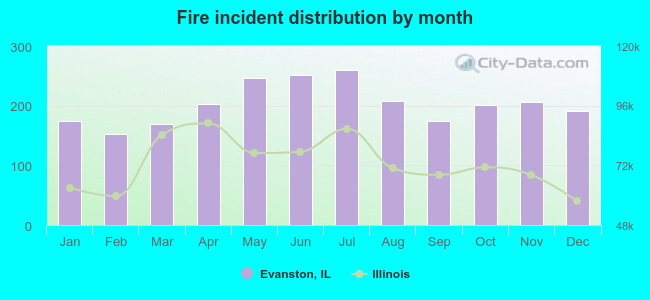 Based on the 2,436 fire incident reports from years 2002 - 2018 most fires (10.7%) took place during July, and the least (6.2%) in February.
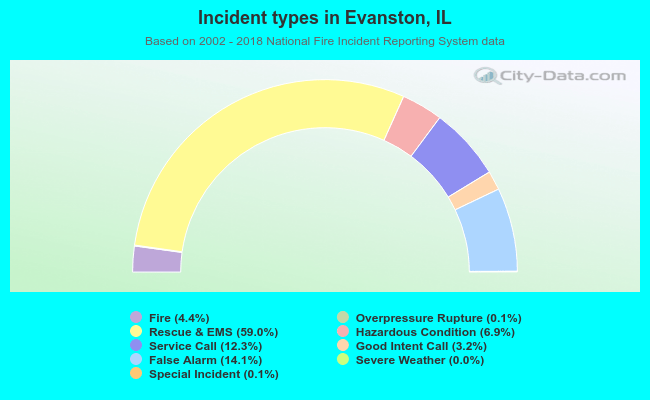 Out of all 55,848 cases reported during the years 2002 - 2018, the most belonged to the categories: Rescue & EMS (59.0%), False Alarm (14.1%), and Service Call (12.3%).
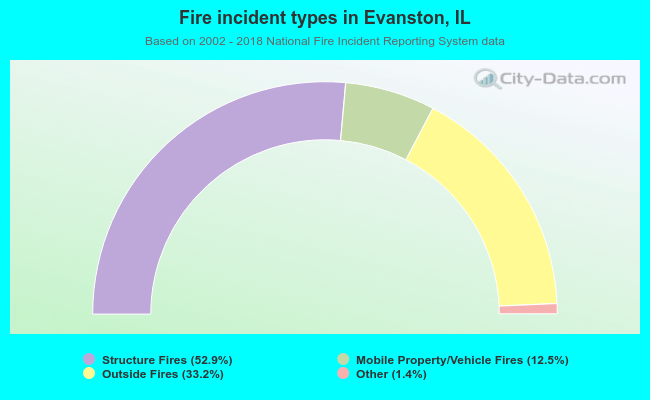 When looking into fire subcategories, the most incidents belonged to: Structure Fires (52.9%), and Outside Fires (33.2%).