Wilmette: Fire Incidents, Illinois (IL)
Where are fire incidents reported in Wilmette, IL
Something went wrong! Please refresh the page.
| Fire incidents reported | |
|---|---|
| Sreet name | Count |
| LAKE AVE | 112 |
| SHERIDAN RD | 72 |
| WILMETTE AVE | 60 |
| CENTRAL AVE | 58 |
| RIDGE RD | 48 |
| ELMWOOD AVE | 44 |
| SKOKIE BLVD | 42 |
| OLD GLENVIEW RD | 40 |
| LINDEN AVE | 28 |
| GREENLEAF AVE | 26 |
| GREENWOOD AVE | 26 |
| 5TH ST | 22 |
| HIBBARD RD | 22 |
| LARAMIE AVE | 22 |
| WASHINGTON AVE | 20 |
| FOREST AVE | 18 |
| IROQUOIS RD | 18 |
| ASHLAND AVE | 16 |
| CHESTNUT AVE | 16 |
| ISABELLA ST | 16 |
| LAKE AV | 16 |
| MAPLE AVE | 16 |
| GREENBAY RD | 12 |
| GREGORY AVE | 12 |
| HIGHLAND AVE | 12 |
| ILLINOIS RD | 12 |
| 11TH ST | 10 |
| 16TH ST | 10 |
| 9TH ST | 10 |
| BIRCHWOOD AVE | 10 |
2002 - 2018 National Fire Incident Reporting System (NFIRS) incidents
- Incident types reported to NFIRS in Wilmette, IL
- 6,92145.0%Rescue & EMS
- 2,34115.2%Hazardous Condition
- 2,31615.0%Service Call
- 1,81511.8%False Alarm
- 1,1147.2%Good Intent Call
- 8065.2%Fire
- 510.3%Severe Weather
- 210.1%Special Incident
- Fire incident types reported to NFIRS in Wilmette, IL
- 51664.0%Structure Fires
- 19524.2%Outside Fires
- 799.8%Mobile Property/Vehicle Fires
- 162.0%Other
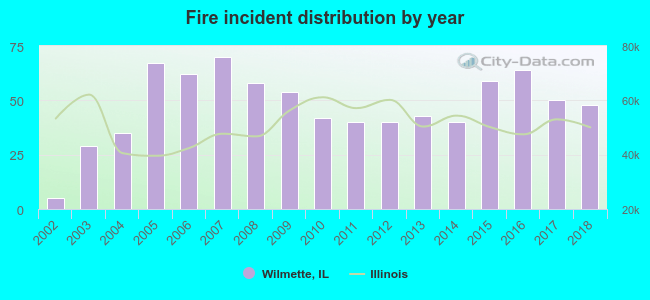 According to the data from the years 2002 - 2018 the average number of fires per year is 47. The highest number of fires - 70 took place in 2007, and the least - 5 in 2002. The data has a rising trend.
The average number of yearly fire incidents per 10k residents in Wilmette, IL compared to nearest cities:
(Note: Based on data for the last 3 years, including only cities with population 5,000 and above)
| Wilmette: | 19.7 |
| Winnetka: | 20.8 |
| Evanston: | 15.6 |
| Skokie: | 12.6 |
| Northfield: | 21.0 |
| Morton Grove: | 14.8 |
| Glencoe: | 7.8 |
| Glenview: | 16.3 |
| Lincolnwood: | 16.8 |
 The median response time based on all reported fire incidents is 4 minutes. This is lower compared to the state median value.
The median response time in Wilmette, IL compared to nearest cities:
(Note: Based on data for all years, including only cities with at least 500 fire incidents)
| Wilmette: | 4 minutes |
| Winnetka: | 4 minutes |
| Evanston: | 4 minutes |
| Skokie: | 5 minutes |
| Morton Grove: | 4 minutes |
| Glenview: | 5 minutes |
| Lincolnwood: | 4 minutes |
| Niles: | 4 minutes |
| Northbrook: | 5 minutes |
 Based on the reports from the years 2002 - 2018 the average number of fire-related yearly casualties is 0. The highest number of casualties - 1 took place in 2008, and the lowest - 0 in 2002. The data has an increasing trend.
The average number of casualties per 1,000 fires is 5. This indicator was the highest - 25 in 2011, and the lowest 0 in 2002. The trend for injuries per 1,000 fire incidents is rising. Compared to the Illinois value the number of injuries per 1,000 fire incidents is much lower.
Based on the reports from the years 2002 - 2018 the average number of fire-related yearly casualties is 0. The highest number of casualties - 1 took place in 2008, and the lowest - 0 in 2002. The data has an increasing trend.
The average number of casualties per 1,000 fires is 5. This indicator was the highest - 25 in 2011, and the lowest 0 in 2002. The trend for injuries per 1,000 fire incidents is rising. Compared to the Illinois value the number of injuries per 1,000 fire incidents is much lower.Casualties per 1,000 incidents in Wilmette, IL compared to nearest cities:
(Note: Based on data for all years, including only cities with at least 500 fire incidents)
| Wilmette: | 5.0 |
| Winnetka: | 15.2 |
| Evanston: | 23.0 |
| Skokie: | 21.4 |
| Morton Grove: | 3.5 |
| Glenview: | 17.9 |
| Lincolnwood: | 22.0 |
| Niles: | 11.2 |
| Northbrook: | 17.2 |
 30.3% incidents where reported in the morning and 69.7% in the evening. The most fires (16.9%) took place on Friday, and the least (11.9%) on Tuesday.
 Based on the 806 fire incident reports from years 2002 - 2018 most fires (12.9%) took place during July, and the least (6.3%) in September.
 Out of all 15,393 cases reported during the years 2002 - 2018, the most belonged to the categories: Rescue & EMS (45.0%), Hazardous Condition (15.2%), and Service Call (15.0%).
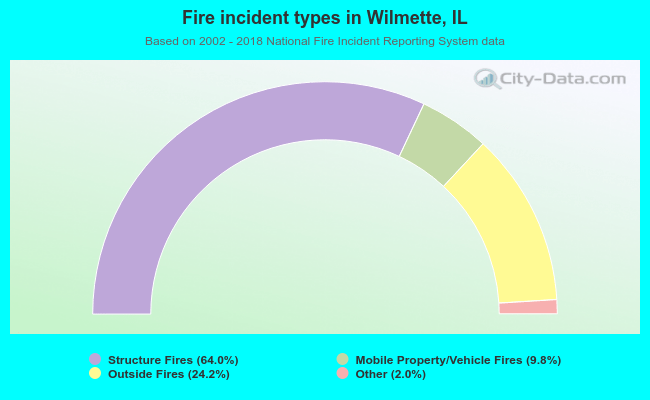 When looking into fire subcategories, the most reports belonged to: Structure Fires (64.0%), and Outside Fires (24.2%).