Geneva: Fire Incidents, Ohio (OH)
Where are fire incidents reported in Geneva, OH
Something went wrong! Please refresh the page.
| Fire incidents reported | |
|---|---|
| Sreet name | Count |
| RIDGE RD | 112 |
| MYERS RD | 100 |
| STATE ROUTE 534 | 98 |
| MAIN ST | 86 |
| AUSTIN RD | 74 |
| LAKE RD | 74 |
| BROADWAY RD | 62 |
| STATE ROUTE 307 | 60 |
| COUNTY LINE RD | 54 |
| INTERSTATE 90 | 50 |
| MAPLE AVE | 42 |
| AUSTIN RD | 36 |
| NEW LONDON RD | 34 |
| PADANARUM RD | 34 |
| BROADWAY | 32 |
| WEST MAPLE | 28 |
| EASTWOOD ST | 26 |
| EAGLE ST | 22 |
| LAKE ROAD WEST | 22 |
| BARNUM RD | 20 |
| WEST ST | 20 |
| CORK-COLD SPRINGS RD | 18 |
| MECHANICSVILLE RD | 18 |
| N. RIDGE E. | 18 |
| NORTH RIDGE EAST | 18 |
| STATE RD | 18 |
| WEST MAIN ST | 18 |
| RIDGE WEST RD | 16 |
| SOUTH RIVER RD | 16 |
| BISHOP RD | 14 |
| Other | 100 |
2002 - 2018 National Fire Incident Reporting System (NFIRS) incidents
- Incident types reported to NFIRS in Geneva, OH
- 1,81933.2%Hazardous Condition
- 1,34024.4%Fire
- 76413.9%Service Call
- 5319.7%Good Intent Call
- 4939.0%False Alarm
- 4518.2%Rescue & EMS
- 591.1%Severe Weather
- 160.3%Special Incident
- 90.2%Overpressure Rupture
- Fire incident types reported to NFIRS in Geneva, OH
- 70752.8%Structure Fires
- 45834.2%Outside Fires
- 16712.5%Mobile Property/Vehicle Fires
- 80.6%Other
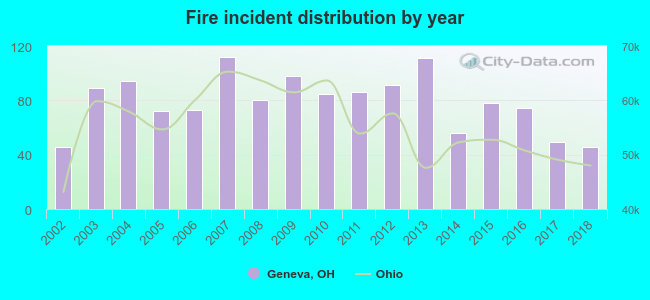 According to the data from the years 2002 - 2018 the average number of fires per year is 79. The highest number of reported fires - 112 took place in 2007, and the least - 46 in 2002. The data has a constant trend.
The average number of yearly fire incidents per 10k residents in Geneva, OH compared to nearest cities:
(Note: Based on data for the last 3 years, including only cities with population 5,000 and above)
| Geneva: | 92.7 |
| North Madison: | 1.2 |
| Ashtabula: | 98.7 |
| Painesville: | 54.8 |
| Chardon: | 147.8 |
| Conneaut: | 78.8 |
| Mentor: | 21.3 |
| Kirtland: | 63.1 |
| Willoughby: | 58.9 |
 The median response time based on all reported fire incidents is 7 minutes. This is similar to the state median value.
The median response time in Geneva, OH compared to nearest cities:
(Note: Based on data for all years, including only cities with at least 500 fire incidents)
| Geneva: | 7 minutes |
| Madison: | 7 minutes |
| Ashtabula: | 6 minutes |
| Jefferson: | 10 minutes |
| Perry: | 6 minutes |
| Painesville: | 5 minutes |
| Chardon: | 7 minutes |
| Conneaut: | 5 minutes |
| Mentor: | 6 minutes |
 According to the data from the years 2002 - 2018 the average number of fire-related yearly casualties is 1. The highest number of injuries - 3 took place in 2003, and the lowest - 0 in 2004. The data has an increasing trend.
The average number of injuries per 1,000 fires is 17. This indicator was the highest - 65 in 2018, and the lowest 0 in 2004. The trend for injuries per 1,000 fire incidents is rising. Compared to the Ohio value the number of injuries per 1,000 incidents is similar.
According to the data from the years 2002 - 2018 the average number of fire-related yearly casualties is 1. The highest number of injuries - 3 took place in 2003, and the lowest - 0 in 2004. The data has an increasing trend.
The average number of injuries per 1,000 fires is 17. This indicator was the highest - 65 in 2018, and the lowest 0 in 2004. The trend for injuries per 1,000 fire incidents is rising. Compared to the Ohio value the number of injuries per 1,000 incidents is similar.
 31.9% incidents where reported in the morning and 68.1% in the evening. The most fires (16.1%) took place on Sunday, and the least (12.9%) on Friday.
 Based on the 1,340 incident reports from years 2002 - 2018 most fires (11.0%) took place during April, and the least (5.7%) in October.
 Out of all 5,482 cases reported during the years 2002 - 2018, the most belonged to the categories: Hazardous Condition (33.2%), Fire (24.4%), and Service Call (13.9%).
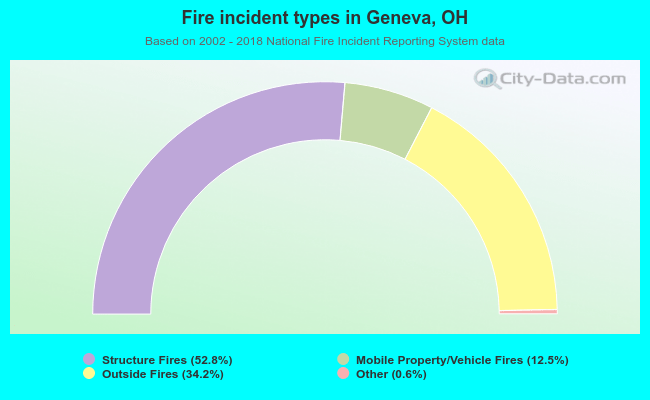 When looking into fire subcategories, the most incidents belonged to: Structure Fires (52.8%), and Outside Fires (34.2%).