Madison: Fire Incidents, Ohio (OH)
Where are fire incidents reported in Madison, OH
Something went wrong! Please refresh the page.
| Fire incidents reported | |
|---|---|
| Sreet name | Count |
| MAIN ST | 70 |
| DOCK RD | 58 |
| NORTH RIDGE (6000-6656) RD | 48 |
| HUBBARD (1301-2699 ODD) RD | 46 |
| RIVER ST | 46 |
| HUBBARD (1300-2698 EVEN) RD | 40 |
| PARADISE BLVD | 40 |
| NORTH RIDGE60006656 RD | 38 |
| BENNETT RD | 36 |
| LAKE ST | 36 |
| CHAPEL (6000-6797) RD | 34 |
| FORD RD | 34 |
| SOUTH RIDGE (5200-6099) RD | 34 |
| OLDSMAR AVE | 30 |
| CLYDE RD | 28 |
| CUMMINGS BLVD | 28 |
| INTERSTATE 90MUTUAL AID | 28 |
| WARNER RD | 28 |
| CHAPEL RD | 26 |
| COUNTY LINE (800-2748) RD | 26 |
| NORTH RIDGE RD | 26 |
| RED BIRD RD | 26 |
| SAFFORD ST | 26 |
| MIDDLE RIDGE RD | 24 |
| NORTH RIDGE (6658-7300) RD | 24 |
| EASTON AVE | 22 |
| HAINES RD | 22 |
| HUBBARD13012699 ODD RD | 22 |
| MADISON AVE | 22 |
| MARTHA DR | 22 |
| Other | 804 |
2002 - 2018 National Fire Incident Reporting System (NFIRS) incidents
- Incident types reported to NFIRS in Madison, OH
- 12,17659.4%Rescue & EMS
- 2,70213.2%Hazardous Condition
- 1,9899.7%Service Call
- 1,7948.8%Fire
- 1,0024.9%Good Intent Call
- 7573.7%False Alarm
- 260.1%Overpressure Rupture
- 240.1%Special Incident
- Fire incident types reported to NFIRS in Madison, OH
- 87748.9%Structure Fires
- 66136.8%Outside Fires
- 23413.0%Mobile Property/Vehicle Fires
- 221.2%Other
 According to the data from the years 2002 - 2018 the average number of fire incidents per year is 106. The highest number of fires - 136 took place in 2012, and the least - 34 in 2018. The data has a declining trend.
 The median response time based on all reported fire incidents is 7 minutes. This is similar to the state median value.
The median response time in Madison, OH compared to nearest cities:
(Note: Based on data for all years, including only cities with at least 500 fire incidents)
| Madison: | 7 minutes |
| Perry: | 6 minutes |
| Geneva: | 7 minutes |
| Painesville: | 5 minutes |
| Jefferson: | 10 minutes |
| Ashtabula: | 6 minutes |
| Chardon: | 7 minutes |
| Mentor: | 6 minutes |
| Kirtland: | 6 minutes |
 Based on the reports from the years 2002 - 2018 the average number of fire-related yearly casualties is 1. The highest number of injuries - 3 took place in 2002, and the lowest - 0 in 2005. The data has a decreasing trend.
The average number of casualties per 1,000 fires is 6. This indicator was the highest - 26 in 2004, and the lowest 0 in 2005. The trend for casualties per 1,000 fire incidents is decreasing. Compared to the Ohio value the number of injuries per 1,000 fires is much lower.
Based on the reports from the years 2002 - 2018 the average number of fire-related yearly casualties is 1. The highest number of injuries - 3 took place in 2002, and the lowest - 0 in 2005. The data has a decreasing trend.
The average number of casualties per 1,000 fires is 6. This indicator was the highest - 26 in 2004, and the lowest 0 in 2005. The trend for casualties per 1,000 fire incidents is decreasing. Compared to the Ohio value the number of injuries per 1,000 fires is much lower.
 28.8% incidents where reported in the morning and 71.2% in the evening. The most fires (17.2%) took place on Sunday, and the least (13.0%) on Tuesday.
 According to the 1,794 fire incidents from years 2002 - 2018 most fires (11.3%) took place during April, and the least (6.0%) in February.
 Out of all 20,488 cases reported during the years 2002 - 2018, the most belonged to the categories: Rescue & EMS (59.4%), Hazardous Condition (13.2%), and Service Call (9.7%).
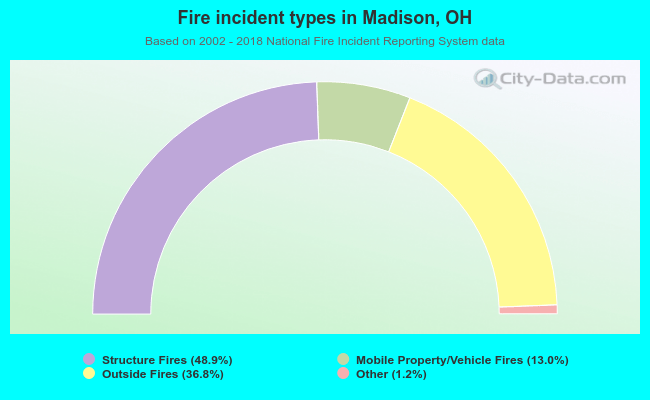 When looking into fire subcategories, the most reports belonged to: Structure Fires (48.9%), and Outside Fires (36.8%).