Gig Harbor: Fire Incidents, Washington (WA)
Where are fire incidents reported in Gig Harbor, WA
Something went wrong! Please refresh the page.
| Fire incidents reported | |
|---|---|
| Sreet name | Count |
| SR16 HWY | 172 |
| PT FOSDICK DR | 166 |
| PURDY DR | 114 |
| HARBORVIEW DR | 80 |
| SR302 HWY | 70 |
| OLYMPIC DR | 66 |
| SOUNDVIEW DR | 66 |
| CRESCENT VALLEY DR | 64 |
| ROSEDALE ST | 62 |
| BURNHAM DR | 52 |
| RAY NASH DR | 48 |
| SR302 | 48 |
| 38TH AVE | 38 |
| BORGEN BLVD | 38 |
| HUNT ST | 38 |
| KOPACHUCK DR | 38 |
| 29TH ST | 36 |
| 36TH ST | 36 |
| 14TH AVE | 34 |
| 51ST AVE | 32 |
| KIMBALL DR | 32 |
| 144TH ST | 30 |
| 40TH ST | 28 |
| 70TH AVE | 28 |
| PEACOCK HILL AVE | 28 |
| 54TH AVE | 26 |
| 56TH ST | 26 |
| 154TH ST | 24 |
| STINSON AVE | 24 |
| WOLLOCHET DR | 24 |
| Other | 744 |
2002 - 2018 National Fire Incident Reporting System (NFIRS) incidents
- Incident types reported to NFIRS in Gig Harbor, WA
- 14,56362.6%Rescue & EMS
- 2,3129.9%Fire
- 2,2149.5%Good Intent Call
- 1,6797.2%Service Call
- 1,5306.6%Hazardous Condition
- 8163.5%False Alarm
- 1260.5%Special Incident
- 240.1%Severe Weather
- Fire incident types reported to NFIRS in Gig Harbor, WA
- 1,02744.4%Outside Fires
- 83636.2%Structure Fires
- 38316.6%Mobile Property/Vehicle Fires
- 662.9%Other
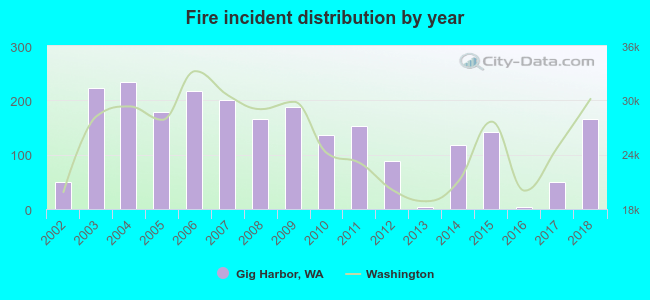 Based on the data from the years 2002 - 2018 the average number of fire incidents per year is 136. The highest number of reported fire incidents - 233 took place in 2004, and the least - 3 in 2013. The data has a growing trend.
The average number of yearly fire incidents per 10k residents in Gig Harbor, WA compared to nearest cities:
(Note: Based on data for the last 3 years, including only cities with population 5,000 and above)
| Gig Harbor: | 86.8 |
| Fircrest: | 9.5 |
| University Place: | 13.1 |
| Vashon: | 33.6 |
| Tacoma: | 50.3 |
| Steilacoom: | 8.1 |
| Lakewood: | 25.9 |
| Federal Way: | 46.6 |
| Fife: | 68.8 |
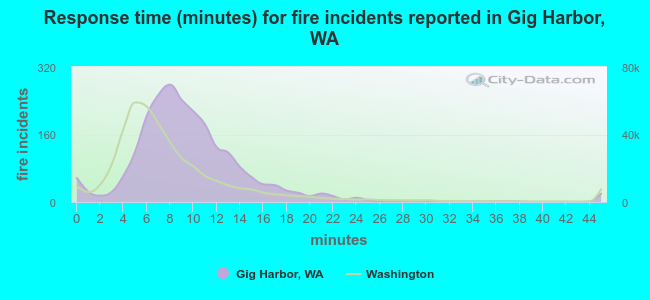 The median response time based on all reported fire incidents is 9 minutes. This is higher than the Washington median value.
The median response time in Gig Harbor, WA compared to nearest cities:
(Note: Based on data for all years, including only cities with at least 500 fire incidents)
| Gig Harbor: | 9 minutes |
| University Place: | 6 minutes |
| Vashon: | 8 minutes |
| Tacoma: | 5 minutes |
| Lakewood: | 7 minutes |
| Federal Way: | 6 minutes |
| Fife: | 5 minutes |
| Belfair: | 9 minutes |
| Des Moines: | 5 minutes |
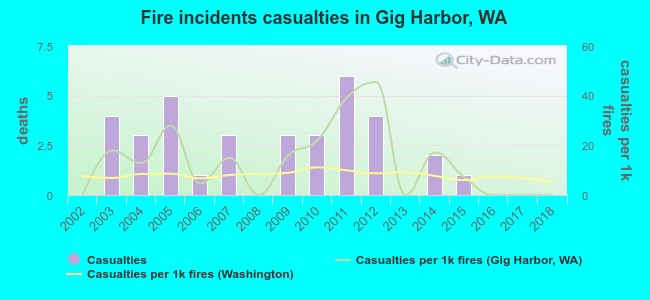 Based on the data from the years 2002 - 2018 the average number of fire-related yearly casualties is 2. The highest number of injuries - 6 took place in 2011, and the lowest - 0 in 2002. The data has a constant trend.
The average number of casualties per 1,000 fire incidents is 13. This indicator was the highest - 45 in 2012, and the lowest 0 in 2002. The trend for injuries per 1,000 fire incidents is constant. Compared to the state value the number of casualties per 1,000 fire incidents is higher.
Based on the data from the years 2002 - 2018 the average number of fire-related yearly casualties is 2. The highest number of injuries - 6 took place in 2011, and the lowest - 0 in 2002. The data has a constant trend.
The average number of casualties per 1,000 fire incidents is 13. This indicator was the highest - 45 in 2012, and the lowest 0 in 2002. The trend for injuries per 1,000 fire incidents is constant. Compared to the state value the number of casualties per 1,000 fire incidents is higher.Casualties per 1,000 incidents in Gig Harbor, WA compared to nearest cities:
(Note: Based on data for all years, including only cities with at least 500 fire incidents)
| Gig Harbor: | 15.1 |
| University Place: | 2.5 |
| Vashon: | 3.2 |
| Tacoma: | 7.5 |
| Lakewood: | 3.2 |
| Federal Way: | 21.1 |
| Fife: | 3.3 |
| Belfair: | 5.1 |
| Des Moines: | 16.0 |
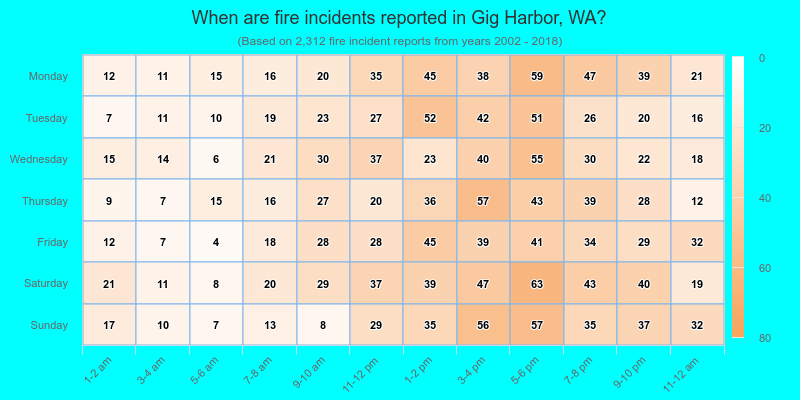
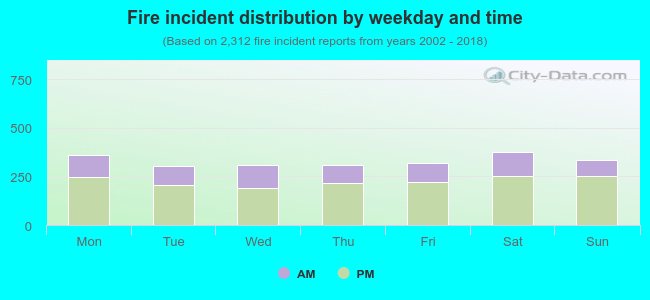 31.6% incidents where reported in the morning and 68.4% in the evening. The most fires (16.3%) took place on Saturday, and the least (13.1%) on Tuesday.
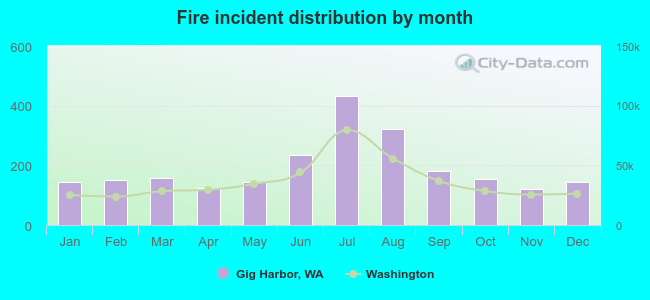 Based on the 2,312 reports from years 2002 - 2018 most fires (18.7%) took place during July, and the least (5.2%) in November.
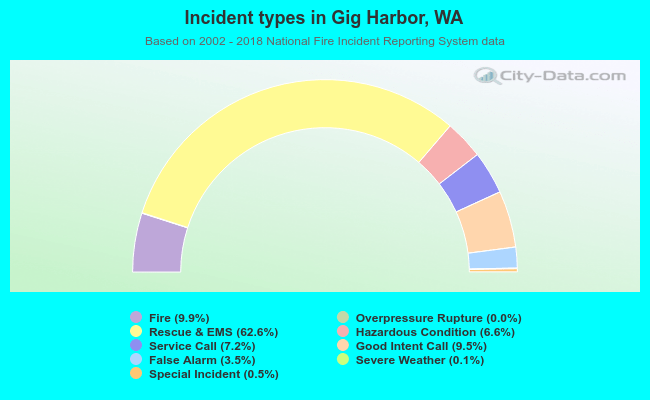 Out of all 23,275 cases reported during the years 2002 - 2018, the most belonged to the categories: Rescue & EMS (62.6%), Fire (9.9%), and Good Intent Call (9.5%).
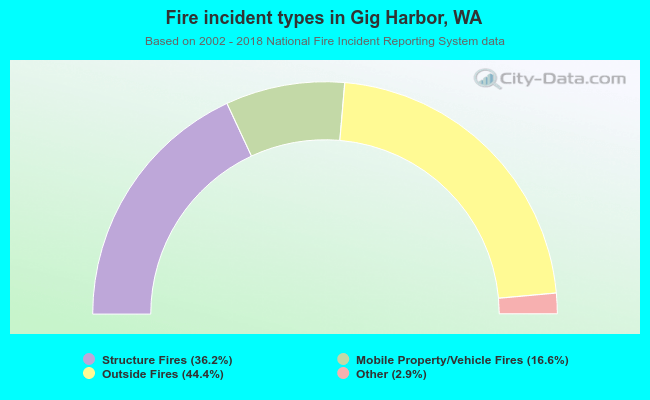 When looking into fire subcategories, the most incidents belonged to: Outside Fires (44.4%), and Structure Fires (36.2%).