Gilberts: Fire Incidents, Illinois (IL)
Where are fire incidents reported in Gilberts, IL
Something went wrong! Please refresh the page.
|
| |||||||||||||||||||||||||||||||||||||||||||||||||||||||||||||||||||||||||||||||||||||||||||||||||||||||||||||
2002 - 2018 National Fire Incident Reporting System (NFIRS) incidents
- Incident types reported to NFIRS in Gilberts, IL
- 1,12444.2%Rescue & EMS
- 43217.0%Fire
- 34613.6%False Alarm
- 27911.0%Good Intent Call
- 27110.7%Hazardous Condition
- 742.9%Service Call
- 130.5%Special Incident
- Fire incident types reported to NFIRS in Gilberts, IL
- 22351.6%Structure Fires
- 15836.6%Outside Fires
- 266.0%Mobile Property/Vehicle Fires
- 255.8%Other
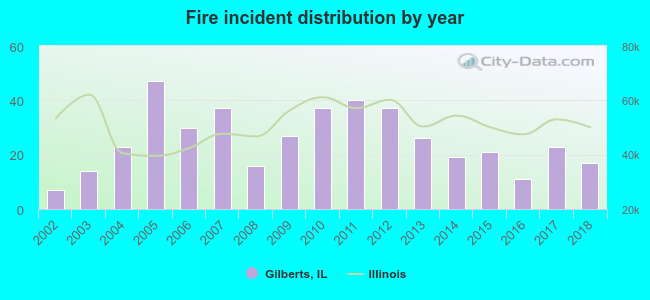 According to the data from the years 2002 - 2018 the average number of fires per year is 25. The highest number of fire incidents - 47 took place in 2005, and the least - 7 in 2002. The data has an increasing trend.
The average number of yearly fire incidents per 10k residents in Gilberts, IL compared to nearest cities:
(Note: Based on data for the last 3 years, including only cities with population 5,000 and above)
| Gilberts: | 22.5 |
| Pingree Grove: | 36.9 |
| West Dundee: | 40.1 |
| Carpentersville: | 23.7 |
| Huntley: | 21.0 |
| Algonquin: | 14.0 |
| Elgin: | 28.3 |
| Lake in the Hills: | 10.8 |
| South Elgin: | 28.5 |

 34.5% incidents where reported in the morning and 65.5% in the evening. The most fires (18.1%) took place on Wednesday, and the least (8.6%) on Friday.
 According to the 432 reports from years 2002 - 2018 most fires (19.2%) took place during April, and the least (4.9%) in December.
 Out of all 2,542 cases reported during the years 2002 - 2018, the most belonged to the categories: Rescue & EMS (44.2%), Fire (17.0%), and False Alarm (13.6%).
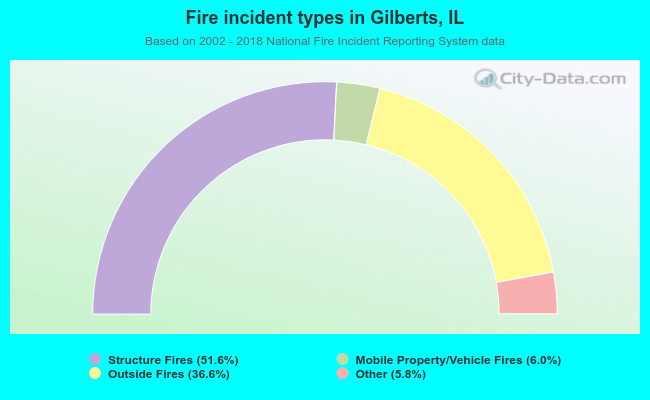 When looking into fire subcategories, the most reports belonged to: Structure Fires (51.6%), and Outside Fires (36.6%).