Elgin: Fire Incidents, Illinois (IL)
Where are fire incidents reported in Elgin, IL
Something went wrong! Please refresh the page.
| Fire incidents reported | |
|---|---|
| Sreet name | Count |
| STATE ST | 564 |
| RANDALL RD | 332 |
| MCLEAN BLVD | 278 |
| CHICAGO ST | 198 |
| HIGHLAND AVE | 142 |
| FLEETWOOD DR | 136 |
| LARKIN AVE | 136 |
| SUMMIT ST | 134 |
| DUNDEE AVE | 120 |
| VILLA ST | 110 |
| LIBERTY ST | 108 |
| BIG TIMBER RD | 104 |
| RAYMOND ST | 98 |
| WING ST | 90 |
| BLUFF CITY BLVD | 88 |
| CENTER ST | 88 |
| WEST RIVER RD | 88 |
| BOWES RD | 86 |
| MARK AVE | 84 |
| ABBOTT DR | 82 |
| GROVE AVE | 82 |
| HOLMES RD | 80 |
| JEFFERSON AVE | 80 |
| ST CHARLES ST | 76 |
| GIFFORD RD | 70 |
| CONGDON AVE | 64 |
| CRYSTAL AVE | 64 |
| AMANDA CIR | 60 |
| SPAULDING RD | 56 |
| TODD FARM DR | 56 |
| Other | 1,789 |
2002 - 2018 National Fire Incident Reporting System (NFIRS) incidents
- Incident types reported to NFIRS in Elgin, IL
- 44,54465.4%Rescue & EMS
- 6,6879.8%Hazardous Condition
- 5,7418.4%False Alarm
- 5,5438.1%Fire
- 3,7865.6%Good Intent Call
- 1,6682.4%Service Call
- Fire incident types reported to NFIRS in Elgin, IL
- 2,51245.3%Structure Fires
- 1,91134.5%Outside Fires
- 91916.6%Mobile Property/Vehicle Fires
- 2013.6%Other
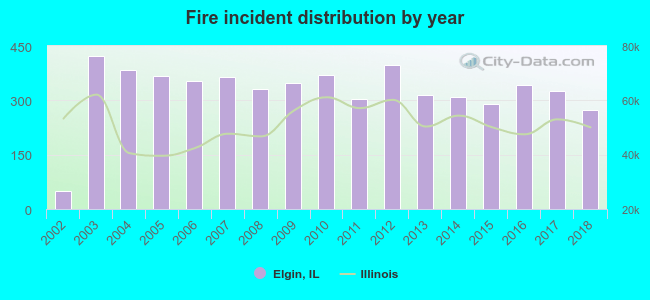 According to the data from the years 2002 - 2018 the average number of fire incidents per year is 326. The highest number of fires - 422 took place in 2003, and the least - 49 in 2002. The data has a rising trend.
The average number of yearly fire incidents per 10k residents in Elgin, IL compared to nearest cities:
(Note: Based on data for the last 3 years, including only cities with population 5,000 and above)
| Elgin: | 28.3 |
| South Elgin: | 28.5 |
| West Dundee: | 40.1 |
| Carpentersville: | 23.7 |
| Gilberts: | 22.5 |
| Streamwood: | 21.8 |
| Bartlett: | 17.8 |
| Pingree Grove: | 36.9 |
| Hanover Park: | 24.4 |
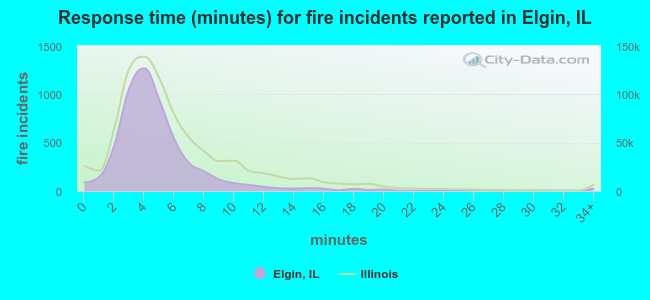 The median response time based on all reported fire incidents is 4 minutes. This is lower compared to the Illinois median value.
The median response time in Elgin, IL compared to nearest cities:
(Note: Based on data for all years, including only cities with at least 500 fire incidents)
| Elgin: | 4 minutes |
| South Elgin: | 5 minutes |
| Carpentersville: | 5 minutes |
| Streamwood: | 5 minutes |
| Bartlett: | 5 minutes |
| Hanover Park: | 4 minutes |
| Algonquin: | 5 minutes |
| St. Charles: | 5 minutes |
| Hoffman Estates: | 5 minutes |
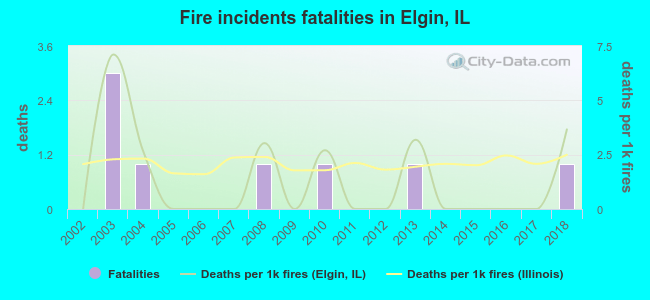 According to the data from the years 2002 - 2018 the average number of fire-related yearly deaths is 0. The highest number of reported deaths - 3 took place in 2003, and the lowest - 0 in 2002. The data has a rising trend.
The average number of deaths per 1,000 fires is 1. This indicator was the highest - 7 in 2003, and the lowest 0 in 2002. The trend for fatalities per 1,000 fires is rising. Compared to the Illinois value the number of deaths per 1,000 incidents is lower.
According to the data from the years 2002 - 2018 the average number of fire-related yearly deaths is 0. The highest number of reported deaths - 3 took place in 2003, and the lowest - 0 in 2002. The data has a rising trend.
The average number of deaths per 1,000 fires is 1. This indicator was the highest - 7 in 2003, and the lowest 0 in 2002. The trend for fatalities per 1,000 fires is rising. Compared to the Illinois value the number of deaths per 1,000 incidents is lower.
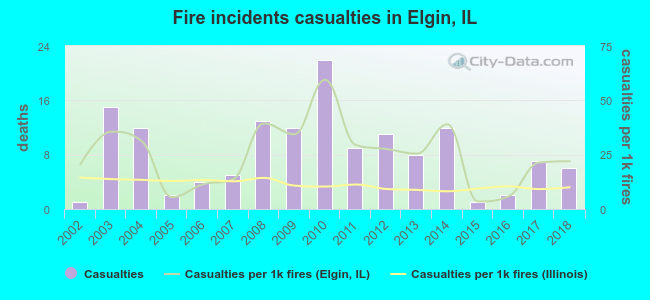 Based on the reports from the years 2002 - 2018 the average number of fire-related yearly casualties is 8. The highest number of reported casualties - 22 took place in 2010, and the lowest - 1 in 2002. The data has a rising trend.
The average number of casualties per 1,000 fire incidents is 25. This indicator was the highest - 59 in 2010, and the lowest 3 in 2015. The trend for injuries per 1,000 fire incidents is increasing. Compared to the state value the number of casualties per 1,000 fires is much higher.
Based on the reports from the years 2002 - 2018 the average number of fire-related yearly casualties is 8. The highest number of reported casualties - 22 took place in 2010, and the lowest - 1 in 2002. The data has a rising trend.
The average number of casualties per 1,000 fire incidents is 25. This indicator was the highest - 59 in 2010, and the lowest 3 in 2015. The trend for injuries per 1,000 fire incidents is increasing. Compared to the state value the number of casualties per 1,000 fires is much higher.Casualties per 1,000 incidents in Elgin, IL compared to nearest cities:
(Note: Based on data for all years, including only cities with at least 500 fire incidents)
| Elgin: | 25.6 |
| South Elgin: | 10.9 |
| Carpentersville: | 13.6 |
| Streamwood: | 15.0 |
| Bartlett: | 11.6 |
| Hanover Park: | 36.5 |
| Algonquin: | 7.7 |
| St. Charles: | 7.9 |
| Hoffman Estates: | 23.6 |
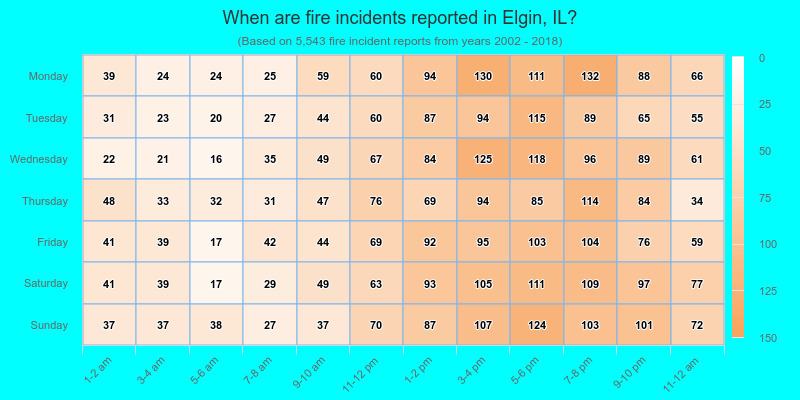
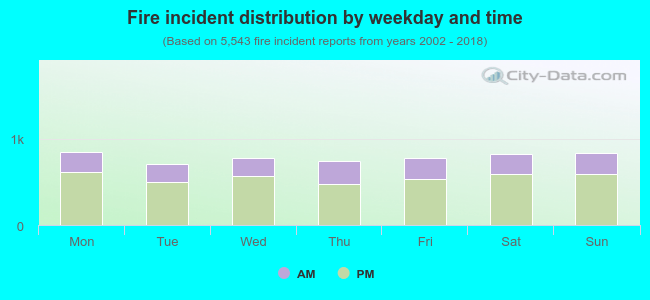 29.7% incidents where reported in the morning and 70.3% in the evening. The most fires (15.4%) took place on Monday, and the least (12.8%) on Tuesday.
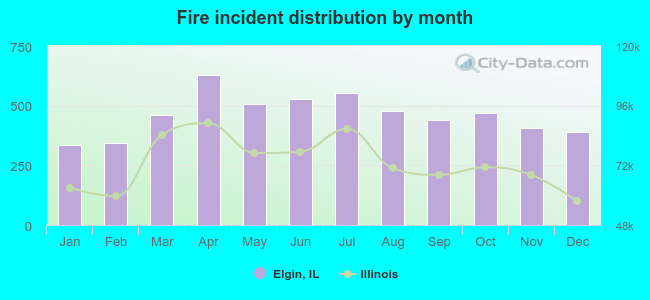 According to the 5,543 fires from years 2002 - 2018 most fires (11.4%) took place during April, and the least (6.1%) in January.
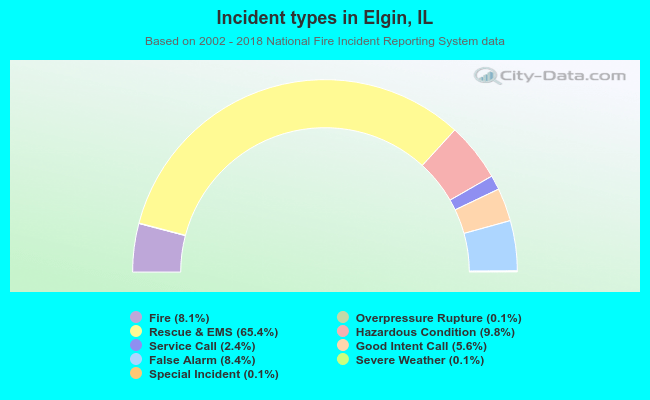 Out of all 68,116 cases reported during the years 2002 - 2018, the most belonged to the categories: Rescue & EMS (65.4%), Hazardous Condition (9.8%), and False Alarm (8.4%).
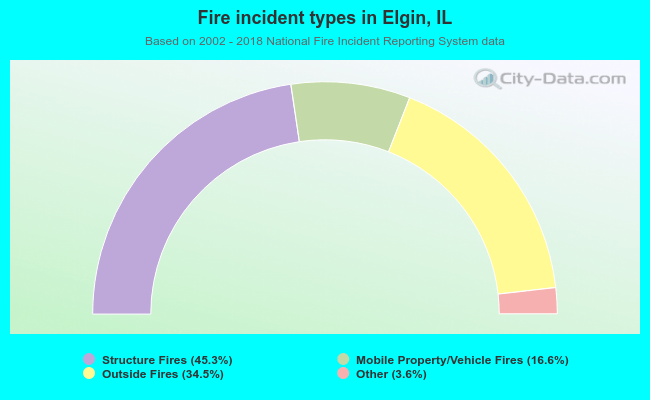 When looking into fire subcategories, the most incidents belonged to: Structure Fires (45.3%), and Outside Fires (34.5%).