Grambling: Fire Incidents, Louisiana (LA)
Where are fire incidents reported in Grambling, LA
Something went wrong! Please refresh the page.
|
| |||||||||||||||||||||||||||||||||||||||||||||||||||||||||||||||||||||||||||||||||||||||||||||||||||||||||||||
2002 - 2018 National Fire Incident Reporting System (NFIRS) incidents
- Incident types reported to NFIRS in Grambling, LA
- 42541.8%Rescue & EMS
- 40539.8%Fire
- 585.7%Hazardous Condition
- 424.1%Service Call
- 414.0%False Alarm
- 302.9%Good Intent Call
- 90.9%Special Incident
- 50.5%Overpressure Rupture
- 20.2%Severe Weather
- Fire incident types reported to NFIRS in Grambling, LA
- 17342.7%Outside Fires
- 14235.1%Structure Fires
- 7819.3%Mobile Property/Vehicle Fires
- 123.0%Other
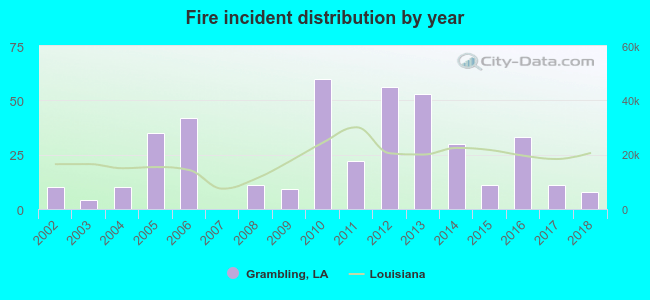 According to the data from the years 2002 - 2018 the average number of fire incidents per year is 24. The highest number of reported fires - 60 took place in 2010, and the least - 0 in 2007. The data has a decreasing trend.
The average number of yearly fire incidents per 10k residents in Grambling, LA compared to nearest cities:
(Note: Based on data for the last 3 years, including only cities with population 5,000 and above)
| Grambling: | 33.8 |
| Ruston: | 42.6 |
| West Monroe: | 210.8 |
| Minden: | 91.1 |
| Monroe: | 70.4 |
| Bastrop: | 126.2 |
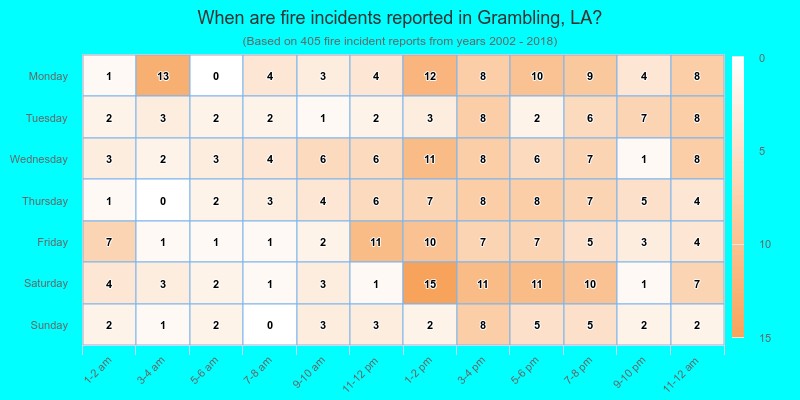
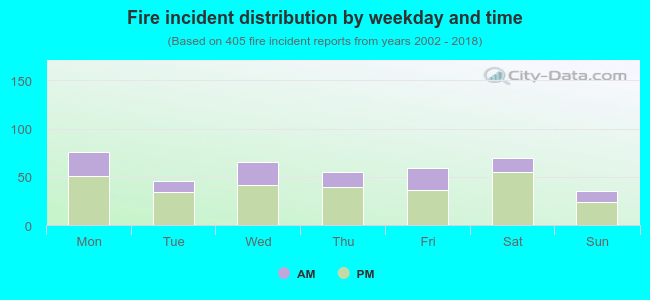 30.9% incidents where reported in the morning and 69.1% in the evening. The most fires (18.8%) took place on Monday, and the least (8.6%) on Sunday.
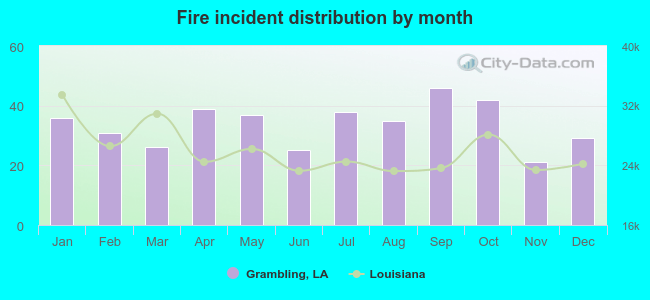 Based on the 405 reports from years 2002 - 2018 most fires (11.4%) took place during September, and the least (5.2%) in November.
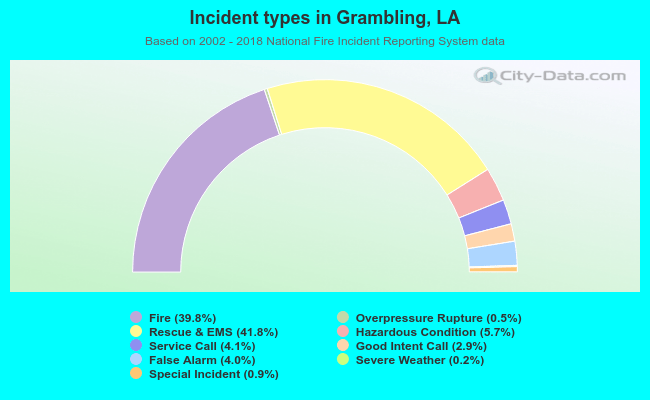 Out of all 1,017 cases reported during the years 2002 - 2018, the most belonged to the categories: Rescue & EMS (41.8%), Fire (39.8%), and Hazardous Condition (5.7%).
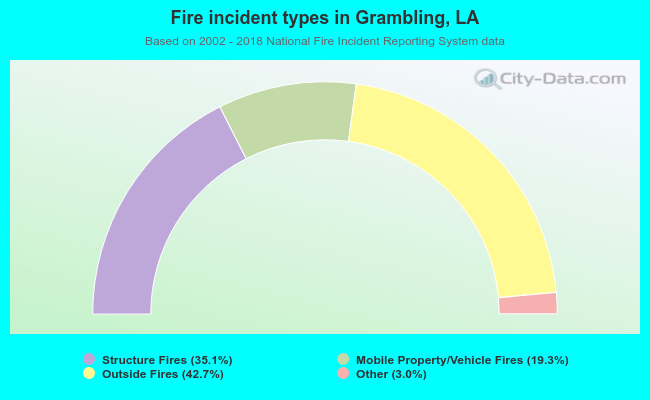 When looking into fire subcategories, the most reports belonged to: Outside Fires (42.7%), and Structure Fires (35.1%).