Grayslake: Fire Incidents, Illinois (IL)
Where are fire incidents reported in Grayslake, IL
Something went wrong! Please refresh the page.
| Fire incidents reported | |
|---|---|
| Sreet name | Count |
| BELVIDERE RD | 122 |
| RT 83 | 102 |
| WASHINGTON ST | 92 |
| COUNTRY DR | 72 |
| RT 45 | 72 |
| ALLEGHANY RD | 62 |
| CENTER ST | 60 |
| BARRON BLVD | 56 |
| ROLLINS RD | 50 |
| HAWLEY ST | 48 |
| GLEN ST | 44 |
| LIBRARY LANE | 38 |
| RT 120 | 38 |
| PETERSON RD | 36 |
| LAKE (GRAYSLAKE) ST | 34 |
| GAGES LAKE RD | 32 |
| CHARDON RD | 30 |
| FAIRFIELD RD | 26 |
| SEYMOUR AVE | 26 |
| BRITTANY SQ | 24 |
| HAWLEY | 22 |
| HIGHLAND RD | 20 |
| IVANHOE RD | 20 |
| SEARS BLVD | 20 |
| HARVEY ST | 18 |
| IDLEWILD DR | 18 |
| LIBRARY LN | 18 |
| ROCK HALL CIR | 18 |
| ROUTE 83 | 18 |
| SLUSSER ST | 18 |
| Other | 440 |
2002 - 2018 National Fire Incident Reporting System (NFIRS) incidents
- Incident types reported to NFIRS in Grayslake, IL
- 14,93561.0%Rescue & EMS
- 3,10912.7%False Alarm
- 1,9628.0%Hazardous Condition
- 1,6946.9%Fire
- 1,6746.8%Service Call
- 9533.9%Good Intent Call
- 910.4%Special Incident
- 580.2%Severe Weather
- Fire incident types reported to NFIRS in Grayslake, IL
- 96857.1%Structure Fires
- 54532.2%Outside Fires
- 1529.0%Mobile Property/Vehicle Fires
- 291.7%Other
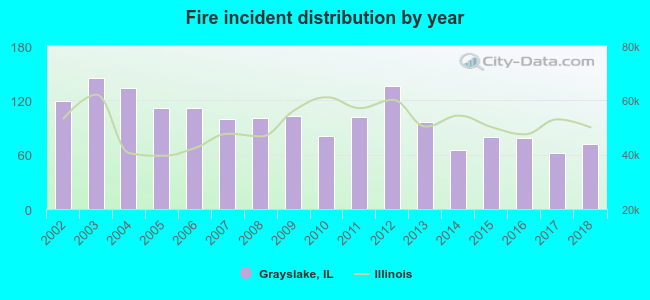 Based on the data from the years 2002 - 2018 the average number of fire incidents per year is 100. The highest number of reported fires - 145 took place in 2003, and the least - 62 in 2017. The data has a decreasing trend.
The average number of yearly fire incidents per 10k residents in Grayslake, IL compared to nearest cities:
(Note: Based on data for the last 3 years, including only cities with population 5,000 and above)
| Grayslake: | 33.6 |
| Gages Lake: | 1.3 |
| Round Lake Park: | 11.3 |
| Round Lake Beach: | 17.4 |
| Round Lake: | 33.3 |
| Lindenhurst: | 8.1 |
| Gurnee: | 23.7 |
| Lake Villa: | 38.1 |
| Libertyville: | 43.1 |
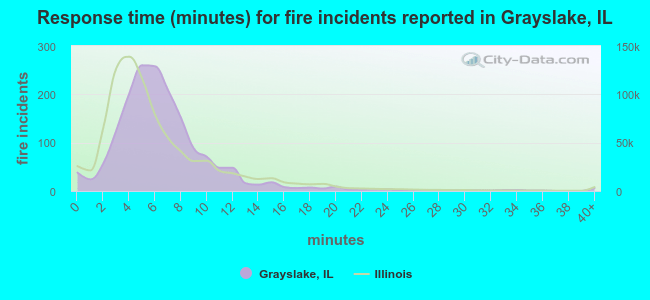 The median response time based on all reported fire incidents is 6 minutes. This is about the same as the state median value.
The median response time in Grayslake, IL compared to nearest cities:
(Note: Based on data for all years, including only cities with at least 500 fire incidents)
| Grayslake: | 6 minutes |
| Round Lake Beach: | 4 minutes |
| Round Lake: | 5 minutes |
| Gurnee: | 6 minutes |
| Lake Villa: | 7 minutes |
| Libertyville: | 5 minutes |
| Mundelein: | 5 minutes |
| Wauconda: | 6 minutes |
| Fox Lake: | 6 minutes |
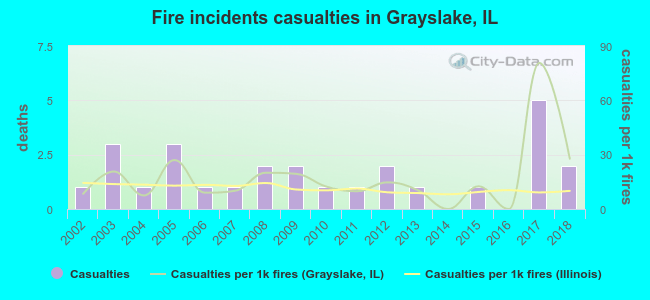 According to the data from the years 2002 - 2018 the average number of fire-related yearly casualties is 2. The highest number of injuries - 5 took place in 2017, and the lowest - 0 in 2014. The data has a rising trend.
The average number of injuries per 1,000 fire incidents is 17. This indicator was the highest - 81 in 2017, and the lowest 0 in 2014. The trend for casualties per 1,000 fire incidents is growing. Compared to the Illinois value the number of injuries per 1,000 fires is higher.
According to the data from the years 2002 - 2018 the average number of fire-related yearly casualties is 2. The highest number of injuries - 5 took place in 2017, and the lowest - 0 in 2014. The data has a rising trend.
The average number of injuries per 1,000 fire incidents is 17. This indicator was the highest - 81 in 2017, and the lowest 0 in 2014. The trend for casualties per 1,000 fire incidents is growing. Compared to the Illinois value the number of injuries per 1,000 fires is higher.Casualties per 1,000 incidents in Grayslake, IL compared to nearest cities:
(Note: Based on data for all years, including only cities with at least 500 fire incidents)
| Grayslake: | 15.9 |
| Round Lake Beach: | 21.8 |
| Round Lake: | 14.2 |
| Gurnee: | 25.4 |
| Lake Villa: | 9.6 |
| Libertyville: | 4.3 |
| Mundelein: | 10.6 |
| Wauconda: | 7.1 |
| Fox Lake: | 2.8 |
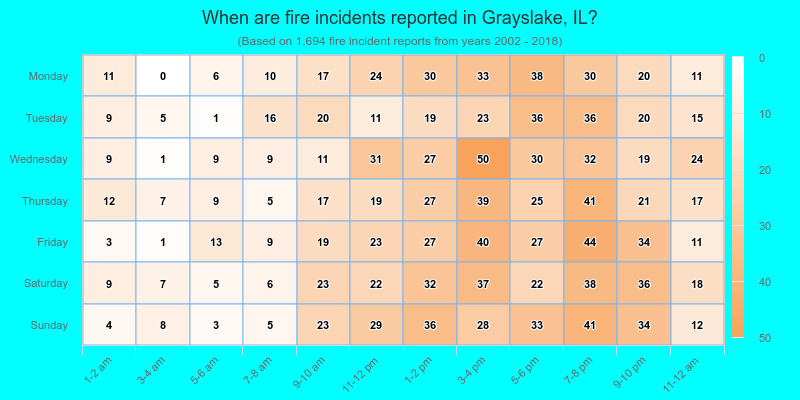
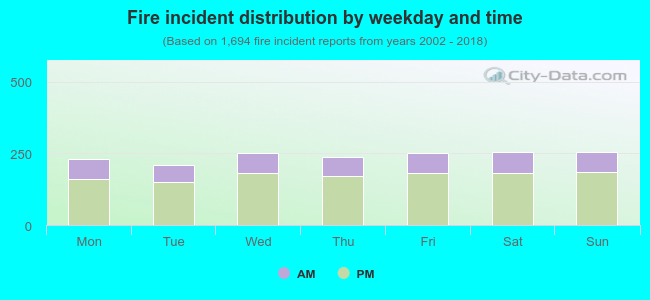 28.4% incidents where reported in the morning and 71.6% in the evening. The most fires (15.1%) took place on Sunday, and the least (12.5%) on Tuesday.
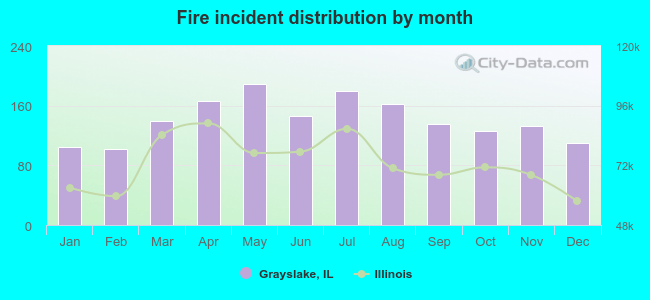 According to the 1,694 reports from years 2002 - 2018 most fires (11.2%) took place during May, and the least (6.0%) in February.
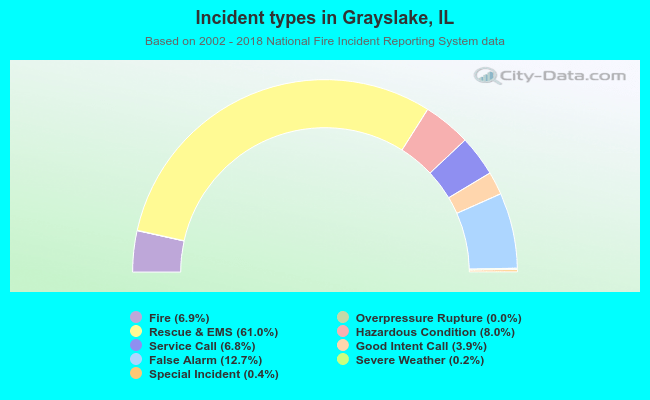 Out of all 24,483 cases reported during the years 2002 - 2018, the most belonged to the categories: Rescue & EMS (61.0%), False Alarm (12.7%), and Hazardous Condition (8.0%).
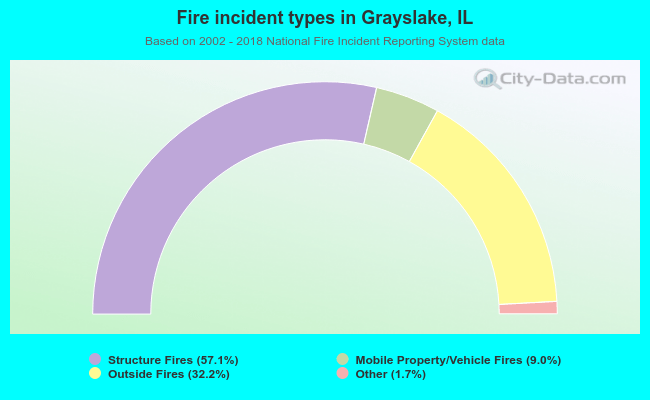 When looking into fire subcategories, the most incidents belonged to: Structure Fires (57.1%), and Outside Fires (32.2%).