Gurnee: Fire Incidents, Illinois (IL)
Where are fire incidents reported in Gurnee, IL
Something went wrong! Please refresh the page.
| Fire incidents reported | |
|---|---|
| Sreet name | Count |
| GRAND AVE | 368 |
| ROUTE 132 | 84 |
| WASHINGTON ST | 78 |
| I-94 | 74 |
| HUNT CLUB RD | 68 |
| CLEARVIEW CT | 60 |
| DELANY RD | 56 |
| ROUTE 41 | 52 |
| GRANDWOOD DR | 48 |
| I94 | 38 |
| ROUTE 21 | 38 |
| DERBY DR | 36 |
| ALMOND RD | 32 |
| INTERSTATE 94 | 30 |
| ROUTE 120 | 28 |
| CENTENNIAL CT | 24 |
| ROUTE 45 | 24 |
| GAGES LAKE RD | 22 |
| IL ROUTE 21 | 22 |
| O'PLAINE RD | 22 |
| DILLEYS RD | 20 |
| OLD GRAND AVE | 20 |
| STEARNS SCHOOL RD | 20 |
| MCCLURE AVE | 18 |
| OPLAINE RD | 18 |
| WEDGEWOOD DR | 18 |
| BLANCHARD RD | 16 |
| GURNEE MILLS BLVD | 16 |
| HUTCHINS RD | 16 |
| SWANSON CT | 16 |
| Other | 155 |
2002 - 2018 National Fire Incident Reporting System (NFIRS) incidents
- Incident types reported to NFIRS in Gurnee, IL
- 19,91859.6%Rescue & EMS
- 3,51310.5%Service Call
- 3,0979.3%False Alarm
- 2,6668.0%Hazardous Condition
- 2,5517.6%Good Intent Call
- 1,5374.6%Fire
- 980.3%Special Incident
- Fire incident types reported to NFIRS in Gurnee, IL
- 70445.8%Structure Fires
- 47130.6%Outside Fires
- 31720.6%Mobile Property/Vehicle Fires
- 452.9%Other
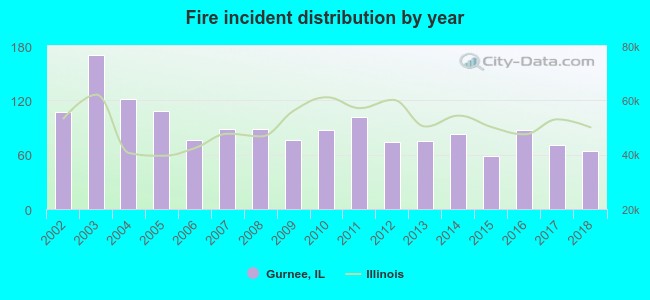 Based on the data from the years 2002 - 2018 the average number of fire incidents per year is 90. The highest number of fire incidents - 170 took place in 2003, and the least - 59 in 2015. The data has a decreasing trend.
The average number of yearly fire incidents per 10k residents in Gurnee, IL compared to nearest cities:
(Note: Based on data for the last 3 years, including only cities with population 5,000 and above)
| Gurnee: | 23.7 |
| Park City: | 14.8 |
| Gages Lake: | 1.3 |
| Waukegan: | 31.8 |
| Grayslake: | 33.6 |
| North Chicago: | 29.5 |
| Beach Park: | 45.0 |
| Lindenhurst: | 8.1 |
| Libertyville: | 43.1 |
 The median response time based on all reported fire incidents is 6 minutes. This is about the same as the state median value.
The median response time in Gurnee, IL compared to nearest cities:
(Note: Based on data for all years, including only cities with at least 500 fire incidents)
| Gurnee: | 6 minutes |
| Waukegan: | 5 minutes |
| Wadsworth: | 7 minutes |
| Grayslake: | 6 minutes |
| North Chicago: | 3 minutes |
| Beach Park: | 6 minutes |
| Libertyville: | 5 minutes |
| Zion: | 5 minutes |
| Round Lake Beach: | 4 minutes |
 According to the reports from the years 2002 - 2018 the average number of fire-related casualties per year is 2. The highest number of reported injuries - 6 took place in 2005, and the lowest - 0 in 2017. The data has a declining trend.
The average number of casualties per 1,000 fire incidents is 25. This indicator was the highest - 56 in 2005, and the lowest 0 in 2017. The trend for injuries per 1,000 fire incidents is declining. Compared to the Illinois value the number of casualties per 1,000 fire incidents is much higher.
According to the reports from the years 2002 - 2018 the average number of fire-related casualties per year is 2. The highest number of reported injuries - 6 took place in 2005, and the lowest - 0 in 2017. The data has a declining trend.
The average number of casualties per 1,000 fire incidents is 25. This indicator was the highest - 56 in 2005, and the lowest 0 in 2017. The trend for injuries per 1,000 fire incidents is declining. Compared to the Illinois value the number of casualties per 1,000 fire incidents is much higher.Casualties per 1,000 incidents in Gurnee, IL compared to nearest cities:
(Note: Based on data for all years, including only cities with at least 500 fire incidents)
| Gurnee: | 25.4 |
| Waukegan: | 23.1 |
| Wadsworth: | 5.1 |
| Grayslake: | 15.9 |
| North Chicago: | 6.9 |
| Beach Park: | 8.1 |
| Libertyville: | 4.3 |
| Zion: | 11.7 |
| Round Lake Beach: | 21.8 |
 30.3% incidents where reported in the morning and 69.7% in the evening. The most fires (16.2%) took place on Tuesday, and the least (13.3%) on Thursday.
 According to the 1,537 incident reports from years 2002 - 2018 most fires (10.8%) took place during July, and the least (6.4%) in January.
 Out of all 33,414 cases reported during the years 2002 - 2018, the most belonged to the categories: Rescue & EMS (59.6%), Service Call (10.5%), and False Alarm (9.3%).
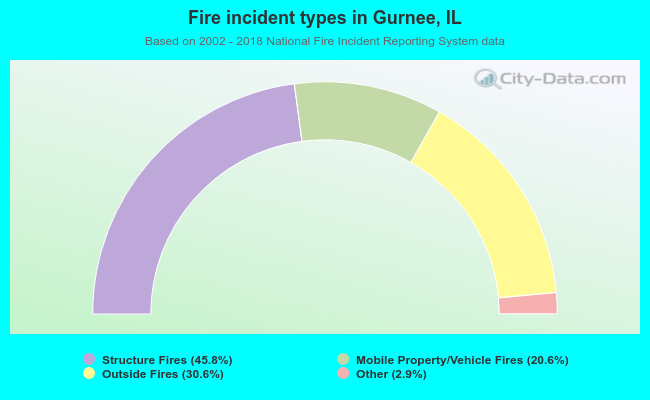 When looking into fire subcategories, the most reports belonged to: Structure Fires (45.8%), and Outside Fires (30.6%).