Hiawatha: Fire Incidents, Iowa (IA)
Where are fire incidents reported in Hiawatha, IA
Something went wrong! Please refresh the page.
|
| |||||||||||||||||||||||||||||||||||||||||||||||||||||||||||||||||||||||||||||||||||||||||||||||||||||||||||||
2002 - 2017 National Fire Incident Reporting System (NFIRS) incidents
- Incident types reported to NFIRS in Hiawatha, IA
- 1,91365.2%Rescue & EMS
- 33011.3%Fire
- 2327.9%Hazardous Condition
- 1735.9%Service Call
- 1575.4%False Alarm
- 1083.7%Good Intent Call
- 160.5%Severe Weather
- 30.1%Special Incident
- Fire incident types reported to NFIRS in Hiawatha, IA
- 17954.2%Structure Fires
- 8626.1%Outside Fires
- 5115.5%Mobile Property/Vehicle Fires
- 144.2%Other
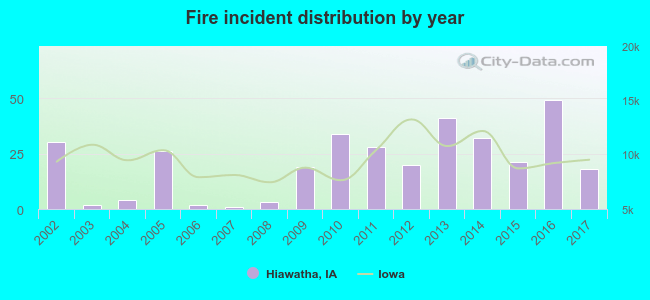 Based on the data from the years 2002 - 2017 the average number of fires per year is 21. The highest number of reported fire incidents - 49 took place in 2016, and the least - 1 in 2007. The data has a dropping trend.
The average number of yearly fire incidents per 10k residents in Hiawatha, IA compared to nearest cities:
(Note: Based on data for the last 3 years, including only cities with population 5,000 and above)
| Hiawatha: | 46.8 |
| Cedar Rapids: | 20.4 |
| Marion: | 16.2 |
| Vinton: | 29.1 |
| Anamosa: | 15.4 |
| North Liberty: | 15.4 |
| Coralville: | 17.0 |
| Iowa City: | 9.8 |
| Independence: | 18.9 |
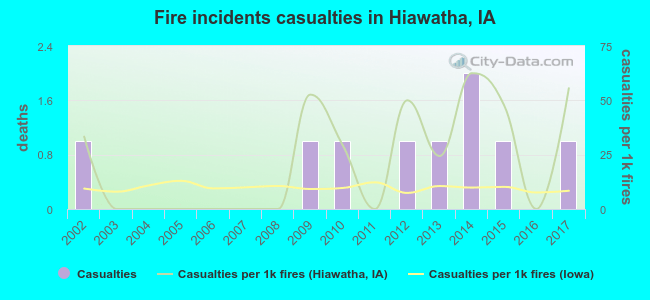 Based on the data from the years 2002 - 2017 the average number of fire-related casualties per year is 1. The highest number of injuries - 2 took place in 2014, and the lowest - 0 in 2003. The data has a constant trend.
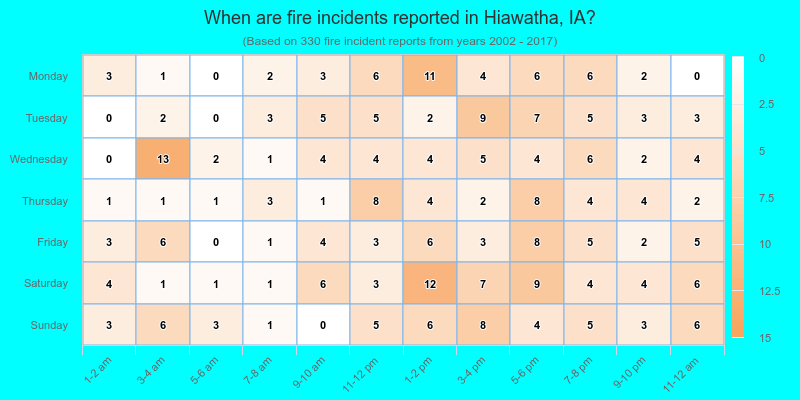
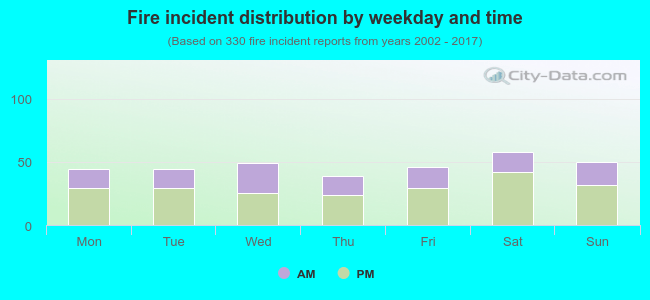 36.4% incidents where reported in the morning and 63.6% in the evening. The most fires (17.6%) took place on Saturday, and the least (11.8%) on Thursday.
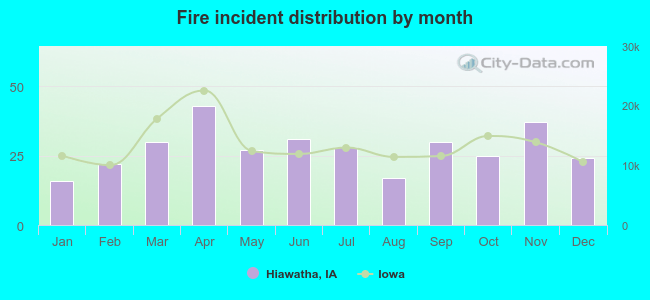 Based on the 330 reports from years 2002 - 2017 most fires (13.0%) took place during April, and the least (4.8%) in January.
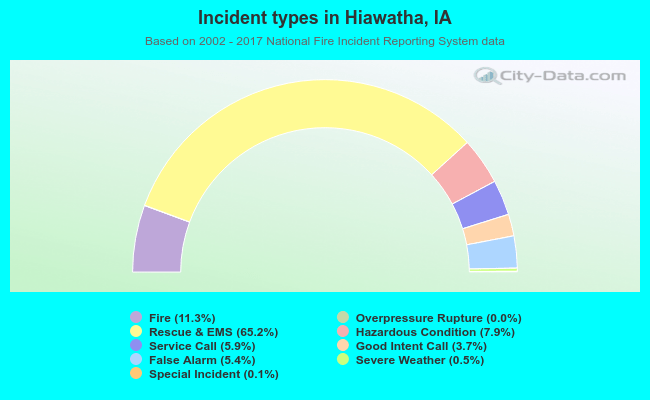 Out of all 2,933 cases reported during the years 2002 - 2017, the most belonged to the categories: Rescue & EMS (65.2%), Fire (11.3%), and Hazardous Condition (7.9%).
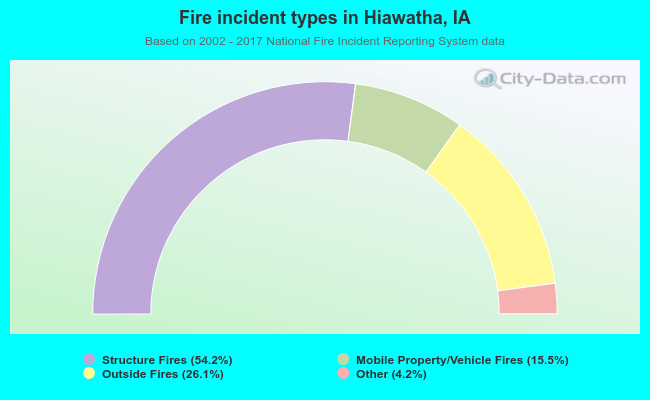 When looking into fire subcategories, the most reports belonged to: Structure Fires (54.2%), and Outside Fires (26.1%).