Marion: Fire Incidents, Iowa (IA)
Where are fire incidents reported in Marion, IA
Something went wrong! Please refresh the page.
| Fire incidents reported | |
|---|---|
| Sreet name | Count |
| 7TH AVE | 72 |
| COUNTY HOME RD | 60 |
| HIGHWAY 13 | 42 |
| ALBURNETT RD | 38 |
| GRAND AVE | 38 |
| HIGHWAY 151 | 38 |
| 5TH AVE | 34 |
| BENTLEY DR | 30 |
| MARION BLVD | 30 |
| 8TH AVE | 28 |
| 10TH ST | 26 |
| 7 AVE | 26 |
| BLAIRS FERRY RD | 26 |
| LINDALE DR | 26 |
| 151 HWY | 24 |
| 10 ST | 22 |
| MEADOWVIEW DR | 22 |
| 8 AVE | 20 |
| FAIRVIEW DR | 20 |
| 13TH ST | 18 |
| TWIXT TOWN RD | 18 |
| 6TH AVE | 16 |
| 9TH ST | 16 |
| ECHO HILL RD | 16 |
| HINDMAN RD | 16 |
| SOUTHVIEW DR | 16 |
| 11 ST | 14 |
| 44TH ST | 14 |
| 4TH AVE | 14 |
| MARTIN CREEK RD | 14 |
| Other | 277 |
2002 - 2017 National Fire Incident Reporting System (NFIRS) incidents
- Incident types reported to NFIRS in Marion, IA
- 1,35331.7%Hazardous Condition
- 1,07125.1%Fire
- 90321.2%False Alarm
- 50611.9%Service Call
- 3017.1%Good Intent Call
- 571.3%Overpressure Rupture
- 521.2%Rescue & EMS
- 140.3%Severe Weather
- 120.3%Special Incident
- Fire incident types reported to NFIRS in Marion, IA
- 46443.3%Structure Fires
- 38335.8%Outside Fires
- 19217.9%Mobile Property/Vehicle Fires
- 323.0%Other
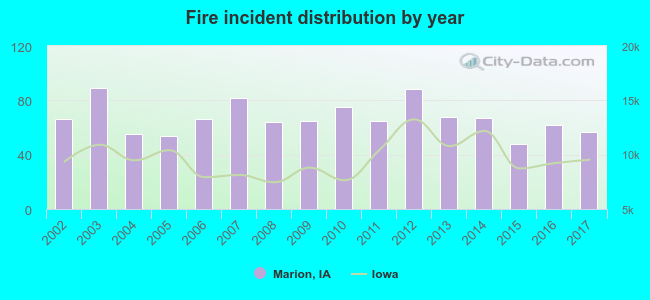 According to the data from the years 2002 - 2017 the average number of fires per year is 67. The highest number of fire incidents - 89 took place in 2003, and the least - 48 in 2015. The data has a decreasing trend.
The average number of yearly fire incidents per 10k residents in Marion, IA compared to nearest cities:
(Note: Based on data for the last 3 years, including only cities with population 5,000 and above)
| Marion: | 16.2 |
| Hiawatha: | 46.8 |
| Cedar Rapids: | 20.4 |
| Anamosa: | 15.4 |
| North Liberty: | 15.4 |
| Vinton: | 29.1 |
| Coralville: | 17.0 |
| Iowa City: | 9.8 |
| Manchester: | 28.2 |
 The median response time based on all reported fire incidents is 5 minutes. This is lower than the state median value.
The median response time in Marion, IA compared to nearest cities:
(Note: Based on data for all years, including only cities with at least 500 fire incidents)
| Marion: | 5 minutes |
| Cedar Rapids: | 6 minutes |
| Coralville: | 7 minutes |
| Iowa City: | 5 minutes |
 Based on the data from the years 2002 - 2017 the average number of fire-related yearly deaths is 0. The highest number of reported deaths - 1 took place in 2002, and the lowest - 0 in 2003. The data has a declining trend.
 Based on the data from the years 2002 - 2017 the average number of fire-related casualties per year is 1. The highest number of injuries - 4 took place in 2005, and the lowest - 0 in 2006. The data has an increasing trend.
The average number of injuries per 1,000 fire incidents is 19. This indicator was the highest - 74 in 2005, and the lowest 0 in 2006. The trend for injuries per 1,000 incidents is rising. Compared to the Iowa value the number of casualties per 1,000 fires is higher.
Based on the data from the years 2002 - 2017 the average number of fire-related casualties per year is 1. The highest number of injuries - 4 took place in 2005, and the lowest - 0 in 2006. The data has an increasing trend.
The average number of injuries per 1,000 fire incidents is 19. This indicator was the highest - 74 in 2005, and the lowest 0 in 2006. The trend for injuries per 1,000 incidents is rising. Compared to the Iowa value the number of casualties per 1,000 fires is higher.Casualties per 1,000 incidents in Marion, IA compared to nearest cities:
(Note: Based on data for all years, including only cities with at least 500 fire incidents)
| Marion: | 18.7 |
| Cedar Rapids: | 17.6 |
| Coralville: | 10.7 |
| Iowa City: | 13.8 |
 30.0% incidents where reported in the morning and 70.0% in the evening. The most fires (15.7%) took place on Monday, and the least (13.2%) on Friday.
 According to the 1,071 reports from years 2002 - 2017 most fires (9.7%) took place during July, and the least (5.7%) in December.
 Out of all 4,269 cases reported during the years 2002 - 2017, the most belonged to the categories: Hazardous Condition (31.7%), Fire (25.1%), and False Alarm (21.2%).
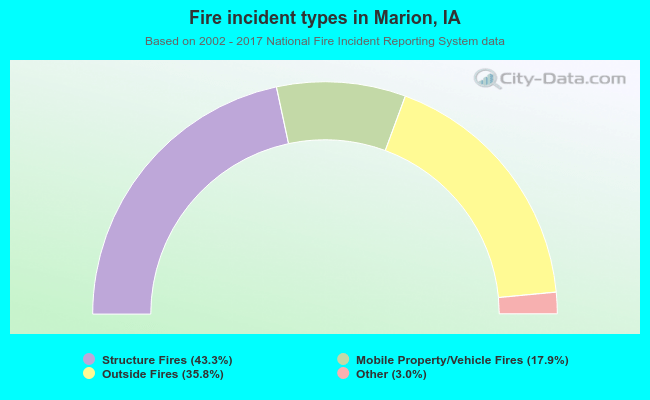 When looking into fire subcategories, the most reports belonged to: Structure Fires (43.3%), and Outside Fires (35.8%).