Hillsboro: Fire Incidents, Illinois (IL)
Where are fire incidents reported in Hillsboro, IL
Something went wrong! Please refresh the page.
|
| |||||||||||||||||||||||||||||||||||||||||||||||||||||||||||||||||||||||||||||||||||||||||||||||||||||||||||||
2002 - 2018 National Fire Incident Reporting System (NFIRS) incidents
- Incident types reported to NFIRS in Hillsboro, IL
- 41437.8%Fire
- 36633.4%Hazardous Condition
- 1049.5%False Alarm
- 908.2%Rescue & EMS
- 777.0%Good Intent Call
- 393.6%Service Call
- 30.3%Overpressure Rupture
- 20.2%Special Incident
- Fire incident types reported to NFIRS in Hillsboro, IL
- 17041.1%Structure Fires
- 14234.3%Outside Fires
- 7317.6%Mobile Property/Vehicle Fires
- 297.0%Other
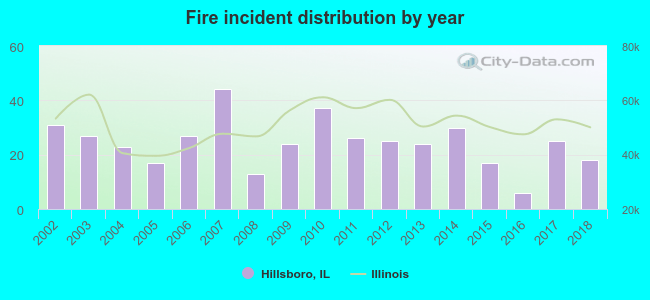 Based on the data from the years 2002 - 2018 the average number of fire incidents per year is 24. The highest number of reported fire incidents - 44 took place in 2007, and the least - 6 in 2016. The data has a dropping trend.
The average number of yearly fire incidents per 10k residents in Hillsboro, IL compared to nearest cities:
(Note: Based on data for the last 3 years, including only cities with population 5,000 and above)
| Hillsboro: | 26.8 |
| Litchfield: | 71.2 |
| Staunton: | 45.5 |
| Greenville: | 63.4 |
| Carlinville: | 72.4 |
| Vandalia: | 39.6 |
| Pana: | 92.5 |
| Taylorville: | 94.2 |
| Highland: | 28.6 |

 27.3% incidents where reported in the morning and 72.7% in the evening. The most fires (19.3%) took place on Saturday, and the least (11.4%) on Tuesday.
 Based on the 414 incident reports from years 2002 - 2018 most fires (13.5%) took place during March, and the least (5.6%) in May.
 Out of all 1,096 cases reported during the years 2002 - 2018, the most belonged to the categories: Fire (37.8%), Hazardous Condition (33.4%), and False Alarm (9.5%).
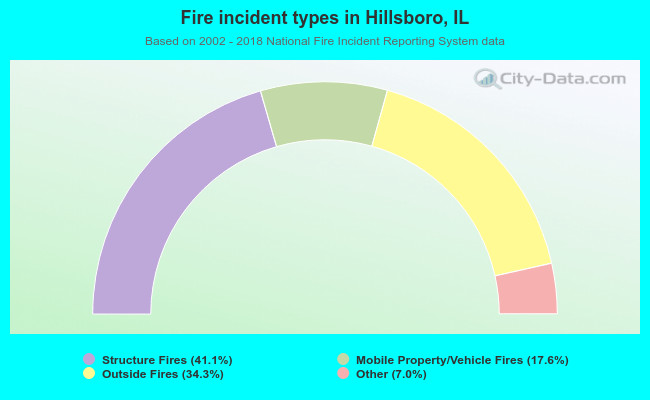 When looking into fire subcategories, the most reports belonged to: Structure Fires (41.1%), and Outside Fires (34.3%).