Highland: Fire Incidents, Illinois (IL)
Where are fire incidents reported in Highland, IL
Something went wrong! Please refresh the page.
|
| |||||||||||||||||||||||||||||||||||||||||||||||||||||||||||||||||||||||||||||||||||||||||||||||||||||||||||||
2002 - 2018 National Fire Incident Reporting System (NFIRS) incidents
- Incident types reported to NFIRS in Highland, IL
- 86735.6%Rescue & EMS
- 48319.8%Fire
- 42717.5%Hazardous Condition
- 30212.4%Good Intent Call
- 27511.3%False Alarm
- 552.3%Service Call
- 140.6%Severe Weather
- 100.4%Overpressure Rupture
- Fire incident types reported to NFIRS in Highland, IL
- 24550.7%Structure Fires
- 13928.8%Outside Fires
- 8417.4%Mobile Property/Vehicle Fires
- 153.1%Other
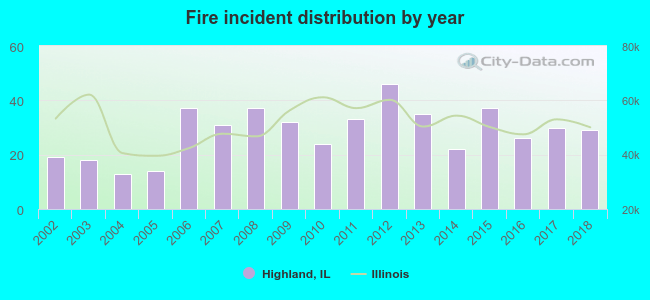 Based on the data from the years 2002 - 2018 the average number of fire incidents per year is 28. The highest number of reported fire incidents - 46 took place in 2012, and the least - 13 in 2004. The data has a growing trend.
The average number of yearly fire incidents per 10k residents in Highland, IL compared to nearest cities:
(Note: Based on data for the last 3 years, including only cities with population 5,000 and above)
| Highland: | 28.6 |
| Troy: | 44.4 |
| Maryville: | 3.8 |
| Edwardsville: | 34.3 |
| Glen Carbon: | 17.8 |
| Collinsville: | 53.9 |
| Greenville: | 63.4 |
| Mascoutah: | 39.8 |
| Shiloh: | 5.4 |
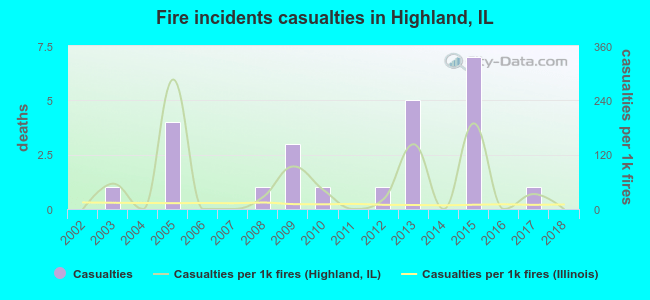 Based on the reports from the years 2002 - 2018 the average number of fire-related yearly casualties is 1. The highest number of injuries - 7 took place in 2015, and the lowest - 0 in 2002. The data has a constant trend.
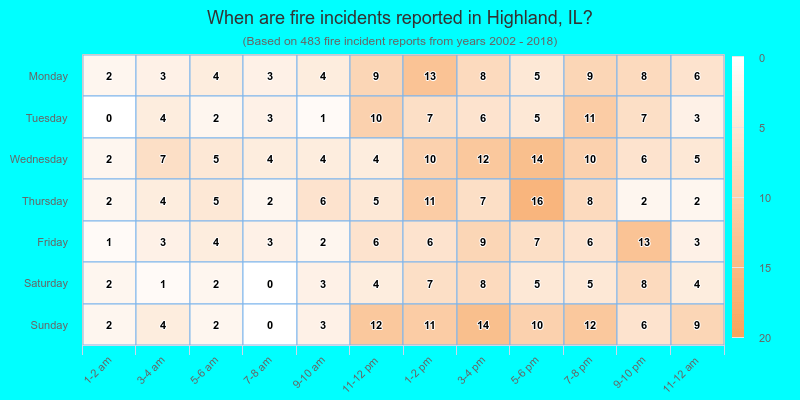
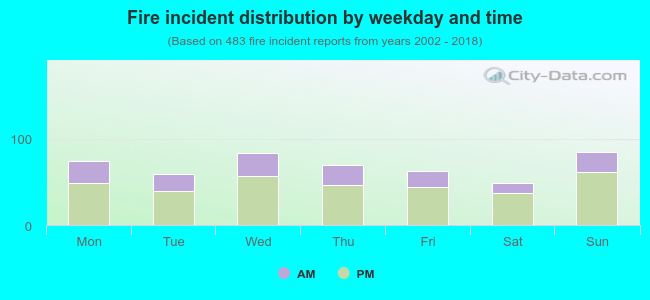 30.8% incidents where reported in the morning and 69.2% in the evening. The most fires (17.6%) took place on Sunday, and the least (10.1%) on Saturday.
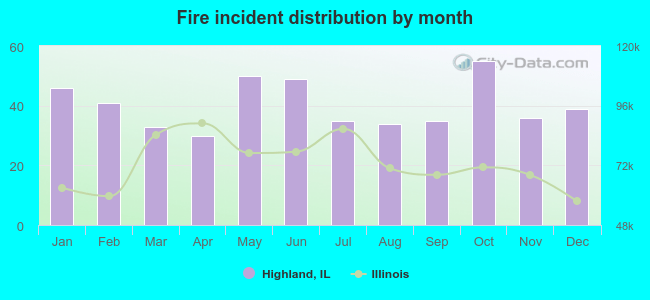 According to the 483 incident reports from years 2002 - 2018 most fires (11.4%) took place during October, and the least (6.2%) in April.
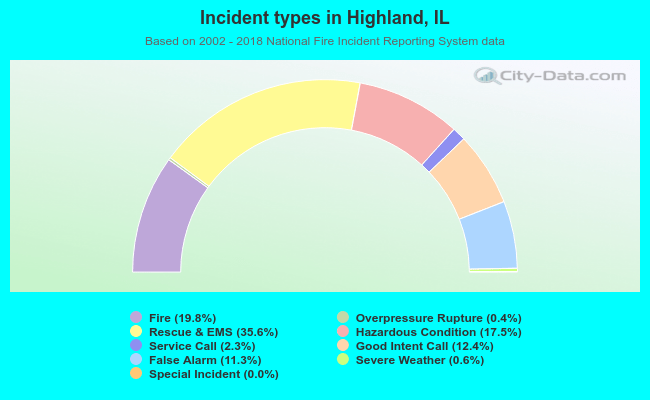 Out of all 2,434 cases reported during the years 2002 - 2018, the most belonged to the categories: Rescue & EMS (35.6%), Fire (19.8%), and Hazardous Condition (17.5%).
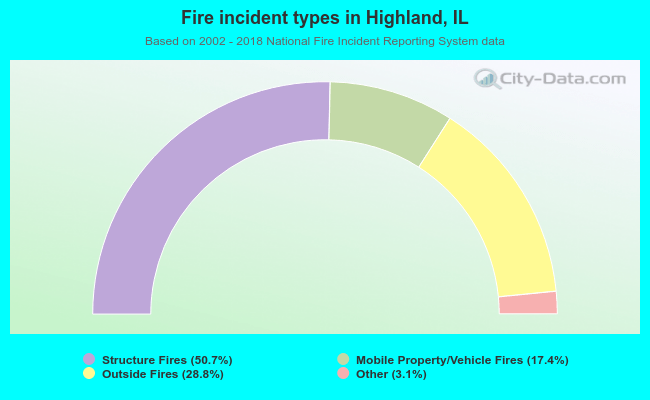 When looking into fire subcategories, the most reports belonged to: Structure Fires (50.7%), and Outside Fires (28.8%).