Hinesville: Fire Incidents, Georgia (GA)
Where are fire incidents reported in Hinesville, GA
Something went wrong! Please refresh the page.
| Fire incidents reported | |
|---|---|
| Sreet name | Count |
| OGLETHORPE HWY | 418 |
| MAIN ST | 158 |
| E G MILES PKY | 96 |
| KELLY DR | 94 |
| GENERAL SCREVEN WAY | 88 |
| HIGHWAY 196 | 84 |
| SAUNDERS AVE | 76 |
| JOHN WELLS RD | 70 |
| HOLLYWOOD DR | 68 |
| AIRPORT RD | 66 |
| PINELAND AVE | 56 |
| 196 HWY | 54 |
| LIVE OAK CHURCH RD | 54 |
| SHAW RD | 48 |
| GLENN BRYANT RD | 44 |
| FRANK COCHRAN DR | 40 |
| RUBEN WELLS RD | 38 |
| BRANTLEY DR | 36 |
| GENERAL STEWART WAY | 34 |
| MEMORIAL DR | 34 |
| REGENCY PL | 34 |
| BRETT DR | 32 |
| LIVE OAK DR | 32 |
| WILLOWBROOK DR | 32 |
| WINDHAVEN DR | 32 |
| DAIRY RD | 30 |
| HENDRY ST | 30 |
| GROOVER RD | 28 |
| OLIVE ST | 28 |
| WELLS RD | 28 |
| Other | 358 |
2002 - 2018 National Fire Incident Reporting System (NFIRS) incidents
- Incident types reported to NFIRS in Hinesville, GA
- 10,40454.2%Rescue & EMS
- 2,35812.3%Hazardous Condition
- 2,32012.1%Fire
- 1,8019.4%Good Intent Call
- 1,3166.9%Service Call
- 8544.4%False Alarm
- 1040.5%Severe Weather
- 270.1%Overpressure Rupture
- 210.1%Special Incident
- Fire incident types reported to NFIRS in Hinesville, GA
- 1,07746.4%Outside Fires
- 86637.3%Structure Fires
- 35815.4%Mobile Property/Vehicle Fires
- 190.8%Other
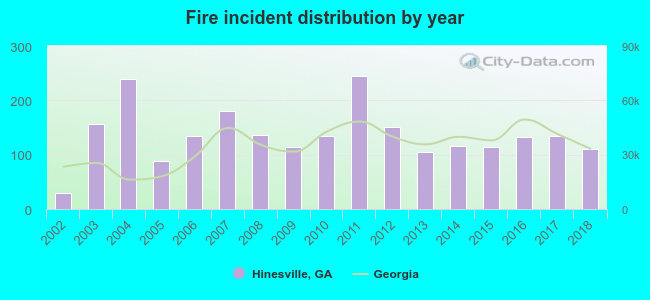 Based on the data from the years 2002 - 2018 the average number of fires per year is 136. The highest number of reported fires - 244 took place in 2011, and the least - 30 in 2002. The data has a rising trend.
The average number of yearly fire incidents per 10k residents in Hinesville, GA compared to nearest cities:
(Note: Based on data for the last 3 years, including only cities with population 5,000 and above)
| Hinesville: | 36.1 |
| Richmond Hill: | 89.6 |
| Glennville: | 116.0 |
| Jesup: | 59.0 |
| Georgetown: | 6.2 |
| Pooler: | 60.2 |
| Garden City: | 134.9 |
| Savannah: | 85.0 |
| Skidaway Island: | 4.8 |
 The median response time based on all reported fire incidents is 6 minutes. This is comparable to the Georgia median value.
The median response time in Hinesville, GA compared to nearest cities:
(Note: Based on data for all years, including only cities with at least 500 fire incidents)
| Hinesville: | 6 minutes |
| Midway: | 10 minutes |
| Richmond Hill: | 6 minutes |
| Jesup: | 9 minutes |
| Bloomingdale: | 6 minutes |
| Pooler: | 6 minutes |
| Claxton: | 7 minutes |
| Garden City: | 5 minutes |
| Savannah: | 4 minutes |
 According to the reports from the years 2002 - 2018 the average number of fire-related fatalities per year is 1. The highest number of reported deaths - 3 took place in 2007, and the lowest - 0 in 2003. The data has an increasing trend.
 Based on the data from the years 2002 - 2018 the average number of fire-related casualties per year is 1. The highest number of injuries - 6 took place in 2010, and the lowest - 0 in 2002. The data has a constant trend.
The average number of casualties per 1,000 fire incidents is 6. This indicator was the highest - 45 in 2010, and the lowest 0 in 2002. The trend for casualties per 1,000 fires is rising. Compared to the state value the number of casualties per 1,000 fire incidents is lower.
Based on the data from the years 2002 - 2018 the average number of fire-related casualties per year is 1. The highest number of injuries - 6 took place in 2010, and the lowest - 0 in 2002. The data has a constant trend.
The average number of casualties per 1,000 fire incidents is 6. This indicator was the highest - 45 in 2010, and the lowest 0 in 2002. The trend for casualties per 1,000 fires is rising. Compared to the state value the number of casualties per 1,000 fire incidents is lower.Casualties per 1,000 incidents in Hinesville, GA compared to nearest cities:
(Note: Based on data for all years, including only cities with at least 500 fire incidents)
| Hinesville: | 6.0 |
| Midway: | 0.0 |
| Richmond Hill: | 4.5 |
| Jesup: | 0.7 |
| Bloomingdale: | 15.8 |
| Pooler: | 20.8 |
| Claxton: | 6.5 |
| Garden City: | 0.8 |
| Savannah: | 7.0 |
 28.0% incidents where reported in the morning and 72.0% in the evening. The most fires (15.1%) took place on Saturday, and the least (13.1%) on Wednesday.
 According to the 2,320 fire incidents from years 2002 - 2018 most fires (12.6%) took place during March, and the least (5.8%) in August.
 Out of all 19,205 cases reported during the years 2002 - 2018, the most belonged to the categories: Rescue & EMS (54.2%), Hazardous Condition (12.3%), and Fire (12.1%).
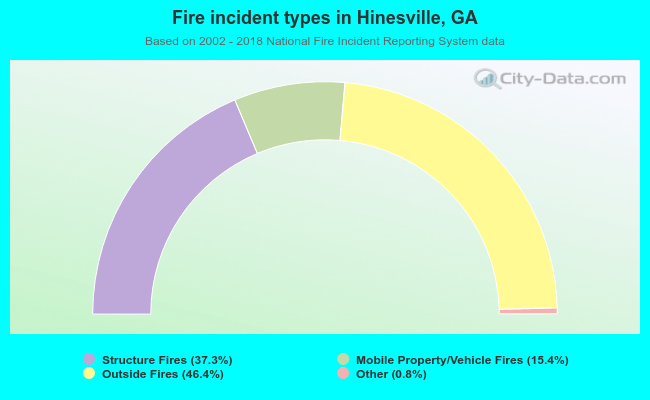 When looking into fire subcategories, the most incidents belonged to: Outside Fires (46.4%), and Structure Fires (37.3%).