Hingham: Fire Incidents, Massachusetts (MA)
Where are fire incidents reported in Hingham, MA
Something went wrong! Please refresh the page.
| Fire incidents reported | |
|---|---|
| Sreet name | Count |
| LINCOLN ST | 126 |
| MAIN ST | 126 |
| SHIPYARD DR | 72 |
| LINCOLN ST | 70 |
| DERBY ST | 68 |
| MAIN ST | 52 |
| SHIPYARD DR | 52 |
| WHITING ST | 50 |
| DERBY ST | 46 |
| HOBART ST | 44 |
| NORTH ST | 42 |
| BEAL ST | 34 |
| FORT HILL ST | 34 |
| WHITING ST | 34 |
| SOUTH ST | 32 |
| ROCKLAND ST | 30 |
| CONDITO RD | 26 |
| EAST ST | 26 |
| BEALS COVE RD | 24 |
| UNION ST | 24 |
| ELM ST | 22 |
| HOBART ST | 22 |
| RHODES CR | 20 |
| THAXTER ST | 20 |
| CENTRAL ST | 18 |
| CUSHING ST | 18 |
| EAST ST | 18 |
| LINDEN PONDS WY | 18 |
| OTIS ST | 18 |
| SUMMER ST | 18 |
| Other | 102 |
2002 - 2018 National Fire Incident Reporting System (NFIRS) incidents
- Incident types reported to NFIRS in Hingham, MA
- 11,46755.0%Rescue & EMS
- 2,34511.2%Hazardous Condition
- 2,31111.1%False Alarm
- 1,7308.3%Service Call
- 1,3866.6%Good Intent Call
- 1,3066.3%Fire
- 2481.2%Severe Weather
- 320.2%Overpressure Rupture
- 240.1%Special Incident
- Fire incident types reported to NFIRS in Hingham, MA
- 57544.0%Structure Fires
- 55842.7%Outside Fires
- 14811.3%Mobile Property/Vehicle Fires
- 251.9%Other
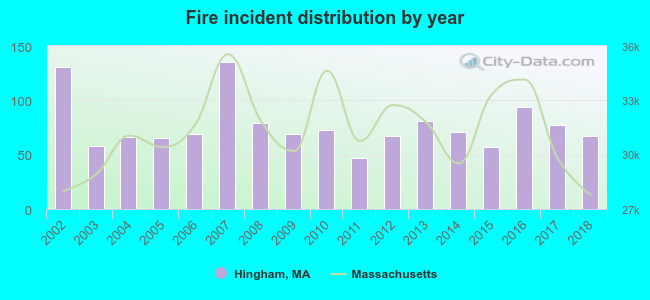 Based on the data from the years 2002 - 2018 the average number of fire incidents per year is 77. The highest number of reported fire incidents - 135 took place in 2007, and the least - 47 in 2011. The data has a declining trend.
The average number of yearly fire incidents per 10k residents in Hingham, MA compared to nearest cities:
(Note: Based on data for the last 3 years, including only cities with population 5,000 and above)
| Hingham: | 140.4 |
| Hull: | 24.6 |
| Weymouth: | 50.1 |
| Cohasset: | 92.4 |
| Braintree: | 24.7 |
| Quincy: | 60.7 |
| Norwell: | 40.0 |
| Rockland: | 46.9 |
| Hanover: | 38.7 |
 The median response time based on all reported fire incidents is 5 minutes. This is higher than the state median value.
The median response time in Hingham, MA compared to nearest cities:
(Note: Based on data for all years, including only cities with at least 500 fire incidents)
| Hingham: | 5 minutes |
| Hull: | 3 minutes |
| Weymouth: | 4 minutes |
| Cohasset: | 6 minutes |
| Braintree: | 3 minutes |
| Quincy: | 3 minutes |
| Norwell: | 5 minutes |
| Rockland: | 3 minutes |
| Hanover: | 5 minutes |
 According to the reports from the years 2002 - 2018 the average number of fire-related yearly casualties is 1. The highest number of casualties - 8 took place in 2016, and the lowest - 0 in 2002. The data has a constant trend.
The average number of casualties per 1,000 fire incidents is 18. This indicator was the highest - 85 in 2016, and the lowest 0 in 2002. The trend for casualties per 1,000 fires is constant. Compared to the state value the number of casualties per 1,000 fires is higher.
According to the reports from the years 2002 - 2018 the average number of fire-related yearly casualties is 1. The highest number of casualties - 8 took place in 2016, and the lowest - 0 in 2002. The data has a constant trend.
The average number of casualties per 1,000 fire incidents is 18. This indicator was the highest - 85 in 2016, and the lowest 0 in 2002. The trend for casualties per 1,000 fires is constant. Compared to the state value the number of casualties per 1,000 fires is higher.
 29.9% incidents where reported in the morning and 70.1% in the evening. The most fires (16.1%) took place on Monday, and the least (12.8%) on Tuesday.
 Based on the 1,306 fire incident reports from years 2002 - 2018 most fires (12.4%) took place during May, and the least (4.6%) in January.
 Out of all 20,849 cases reported during the years 2002 - 2018, the most belonged to the categories: Rescue & EMS (55.0%), Hazardous Condition (11.2%), and False Alarm (11.1%).
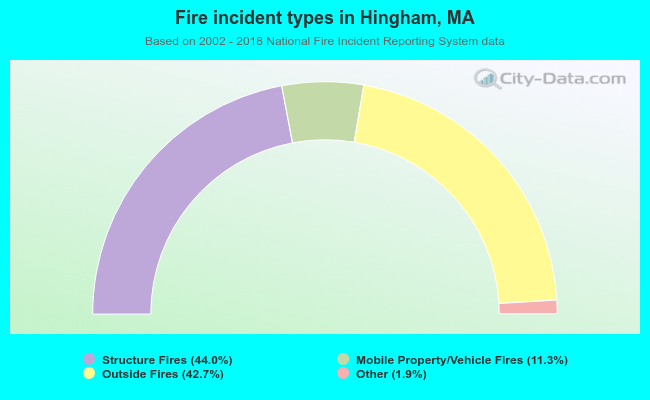 When looking into fire subcategories, the most reports belonged to: Structure Fires (44.0%), and Outside Fires (42.7%).