Quincy: Fire Incidents, Massachusetts (MA)
Where are fire incidents reported in Quincy, MA
Something went wrong! Please refresh the page.
| Fire incidents reported | |
|---|---|
| Sreet name | Count |
| HANCOCK ST | 1,328 |
| WILLARD ST | 670 |
| SOUTHERN ART | 550 |
| SQUANTUM ST | 480 |
| WASHINGTON ST | 460 |
| SEA ST | 416 |
| NEWPORT AVE | 362 |
| QUINCY AVE | 358 |
| SOUTHERN ARTERY | 344 |
| COPELAND ST | 310 |
| BICKNELL ST | 306 |
| CENTRE ST | 296 |
| GRANITE ST | 278 |
| FAXON PARK RD | 264 |
| WATER ST | 252 |
| CLAY ST | 246 |
| QUINCY SHORE DR | 246 |
| SOUTH ST | 224 |
| FALLS BLVD | 216 |
| CLEVERLY CT | 202 |
| QUARRY ST | 198 |
| LONG ISLAND | 196 |
| ADAMS ST | 176 |
| COVE WAY | 176 |
| RICCIUTI DR | 172 |
| NEWBURY AVE | 166 |
| BIGELOW ST | 158 |
| LAWRENCE ST | 158 |
| SPEAR ST | 156 |
| COMMANDER SHEA BLVD | 150 |
| Other | 1,104 |
2002 - 2018 National Fire Incident Reporting System (NFIRS) incidents
- Incident types reported to NFIRS in Quincy, MA
- 31,17945.7%Rescue & EMS
- 10,61815.6%Fire
- 10,11614.8%Hazardous Condition
- 8,16212.0%False Alarm
- 4,7607.0%Service Call
- 3,1434.6%Good Intent Call
- 1370.2%Overpressure Rupture
- 820.1%Special Incident
- Fire incident types reported to NFIRS in Quincy, MA
- 5,75854.2%Structure Fires
- 3,85036.3%Outside Fires
- 7256.8%Mobile Property/Vehicle Fires
- 2852.7%Other
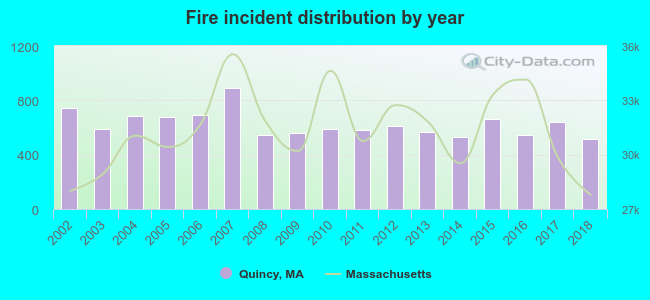 Based on the data from the years 2002 - 2018 the average number of fires per year is 625. The highest number of fires - 892 took place in 2007, and the least - 514 in 2018. The data has a decreasing trend.
The average number of yearly fire incidents per 10k residents in Quincy, MA compared to nearest cities:
(Note: Based on data for the last 3 years, including only cities with population 5,000 and above)
| Quincy: | 60.7 |
| Braintree: | 24.7 |
| Milton: | 54.6 |
| Weymouth: | 50.1 |
| Boston: | 83.7 |
| Hingham: | 140.4 |
| Randolph: | 60.2 |
| Hull: | 24.6 |
| Holbrook: | 47.3 |
 The median response time based on all reported fire incidents is 3 minutes. This is lower than the state median value.
The median response time in Quincy, MA compared to nearest cities:
(Note: Based on data for all years, including only cities with at least 500 fire incidents)
| Quincy: | 3 minutes |
| Braintree: | 3 minutes |
| Milton: | 3 minutes |
| Weymouth: | 4 minutes |
| Boston: | 3 minutes |
| Hingham: | 5 minutes |
| Randolph: | 3 minutes |
| Hull: | 3 minutes |
| Holbrook: | 3 minutes |
 According to the reports from the years 2002 - 2018 the average number of fire-related fatalities per year is 1. The highest number of reported deaths - 4 took place in 2009, and the lowest - 0 in 2003. The data has a decreasing trend.
The average number of deaths per 1,000 fires is 1. This indicator was the highest - 7 in 2009, and the lowest 0 in 2003. The trend for fatalities per 1,000 fires is dropping. Compared to the state value the number of fatalities per 1,000 fires is lower.
According to the reports from the years 2002 - 2018 the average number of fire-related fatalities per year is 1. The highest number of reported deaths - 4 took place in 2009, and the lowest - 0 in 2003. The data has a decreasing trend.
The average number of deaths per 1,000 fires is 1. This indicator was the highest - 7 in 2009, and the lowest 0 in 2003. The trend for fatalities per 1,000 fires is dropping. Compared to the state value the number of fatalities per 1,000 fires is lower.
 Based on the data from the years 2002 - 2018 the average number of fire-related yearly casualties is 2. The highest number of casualties - 8 took place in 2017, and the lowest - 0 in 2012. The data has a dropping trend.
The average number of injuries per 1,000 fires is 4. This indicator was the highest - 12 in 2017, and the lowest 0 in 2012. The trend for injuries per 1,000 incidents is declining. Compared to the state value the number of casualties per 1,000 fires is much lower.
Based on the data from the years 2002 - 2018 the average number of fire-related yearly casualties is 2. The highest number of casualties - 8 took place in 2017, and the lowest - 0 in 2012. The data has a dropping trend.
The average number of injuries per 1,000 fires is 4. This indicator was the highest - 12 in 2017, and the lowest 0 in 2012. The trend for injuries per 1,000 incidents is declining. Compared to the state value the number of casualties per 1,000 fires is much lower.
 28.4% incidents where reported in the morning and 71.6% in the evening. The most fires (15.7%) took place on Sunday, and the least (13.1%) on Tuesday.
 According to the 10,618 fire incidents from years 2002 - 2018 most fires (11.1%) took place during April, and the least (6.4%) in February.
 Out of all 68,238 cases reported during the years 2002 - 2018, the most belonged to the categories: Rescue & EMS (45.7%), Fire (15.6%), and Hazardous Condition (14.8%).
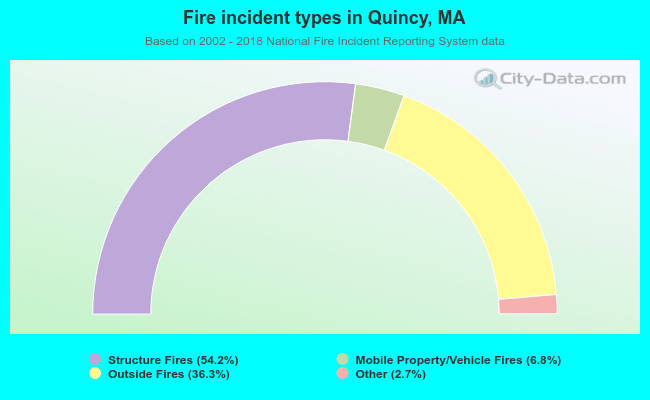 When looking into fire subcategories, the most reports belonged to: Structure Fires (54.2%), and Outside Fires (36.3%).