Leominster: Fire Incidents, Massachusetts (MA)
Where are fire incidents reported in Leominster, MA
Something went wrong! Please refresh the page.
| Fire incidents reported | |
|---|---|
| Sreet name | Count |
| STATE STREET | 392 |
| CENTRAL STREET | 272 |
| MAIN STREET | 236 |
| NORTH MAIN STREET | 208 |
| PLEASANT STREET | 160 |
| WEST STREET | 152 |
| MECHANIC STREET | 128 |
| ORCHARD HILL PARK DRIVE | 124 |
| LANCASTER STREET | 122 |
| SPRUCE STREET | 120 |
| MERRIAM AVENUE | 110 |
| COMMERCIAL ROAD | 106 |
| CENTRAL ST | 104 |
| SACK BOULEVARD | 100 |
| HERITAGE LANE | 96 |
| STATE ST | 96 |
| WATER STREET | 88 |
| MUSKET DRIVE | 86 |
| MAIN ST | 78 |
| WILLARD STREET | 70 |
| TERRACE DRIVE | 68 |
| VISCOLOID AVENUE | 66 |
| ELM STREET | 54 |
| LAURIE DRIVE | 54 |
| ADAMS STREET | 50 |
| MECHANIC ST | 50 |
| HAMILTON STREET | 48 |
| THIRD STREET | 48 |
| UNION STREET | 48 |
| FIFTH STREET | 44 |
| Other | 584 |
2002 - 2018 National Fire Incident Reporting System (NFIRS) incidents
- Incident types reported to NFIRS in Leominster, MA
- 25,14056.5%Rescue & EMS
- 4,81010.8%Hazardous Condition
- 4,2849.6%False Alarm
- 3,9628.9%Fire
- 3,5858.1%Service Call
- 2,0204.5%Good Intent Call
- 6131.4%Special Incident
- Fire incident types reported to NFIRS in Leominster, MA
- 2,41460.9%Structure Fires
- 1,09827.7%Outside Fires
- 3659.2%Mobile Property/Vehicle Fires
- 852.1%Other
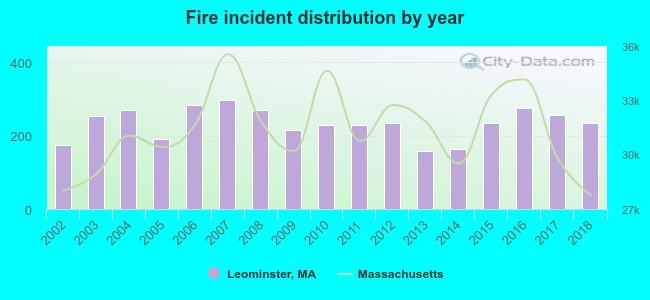 According to the data from the years 2002 - 2018 the average number of fire incidents per year is 233. The highest number of reported fire incidents - 296 took place in 2007, and the least - 157 in 2013. The data has a growing trend.
The average number of yearly fire incidents per 10k residents in Leominster, MA compared to nearest cities:
(Note: Based on data for the last 3 years, including only cities with population 5,000 and above)
| Leominster: | 62.0 |
| Fitchburg: | 120.3 |
| Lancaster: | 34.3 |
| Sterling: | 32.0 |
| Westminster: | 49.9 |
| Harvard: | 36.3 |
| Clinton: | 88.9 |
| West Boylston: | 39.6 |
| Gardner: | 93.2 |
 The median response time based on all reported fire incidents is 4 minutes. This is similar to the state median value.
The median response time in Leominster, MA compared to nearest cities:
(Note: Based on data for all years, including only cities with at least 500 fire incidents)
| Leominster: | 4 minutes |
| Fitchburg: | 4 minutes |
| Lunenburg: | 6 minutes |
| Sterling: | 6 minutes |
| Westminster: | 6 minutes |
| Harvard: | 9 minutes |
| Clinton: | 3 minutes |
| Ayer: | 4 minutes |
| Gardner: | 4 minutes |
 According to the data from the years 2002 - 2018 the average number of fire-related yearly deaths is 0. The highest number of deaths - 1 took place in 2004, and the lowest - 0 in 2002. The data has a constant trend.
The average number of deaths per 1,000 fire incidents is 1. This indicator was the highest - 5 in 2009, and the lowest 0 in 2002. The trend for fatalities per 1,000 fire incidents is constant. Compared to the state value the number of fatalities per 1,000 fires is lower.
According to the data from the years 2002 - 2018 the average number of fire-related yearly deaths is 0. The highest number of deaths - 1 took place in 2004, and the lowest - 0 in 2002. The data has a constant trend.
The average number of deaths per 1,000 fire incidents is 1. This indicator was the highest - 5 in 2009, and the lowest 0 in 2002. The trend for fatalities per 1,000 fire incidents is constant. Compared to the state value the number of fatalities per 1,000 fires is lower.Deaths per 1,000 incidents in Leominster, MA compared to nearest cities:
(Note: Based on data for all years, including only cities with at least 2,500 fire incidents)
| Leominster: | 1.3 |
| Fitchburg: | 1.9 |
| Worcester: | 0.8 |
| Framingham: | 0.5 |
| Lowell: | 3.6 |
 Based on the data from the years 2002 - 2018 the average number of fire-related casualties per year is 2. The highest number of reported injuries - 9 took place in 2010, and the lowest - 0 in 2004. The data has a declining trend.
The average number of casualties per 1,000 fire incidents is 11. This indicator was the highest - 39 in 2010, and the lowest 0 in 2004. The trend for casualties per 1,000 fires is declining. Compared to the state value the number of casualties per 1,000 fires is about the same.
Based on the data from the years 2002 - 2018 the average number of fire-related casualties per year is 2. The highest number of reported injuries - 9 took place in 2010, and the lowest - 0 in 2004. The data has a declining trend.
The average number of casualties per 1,000 fire incidents is 11. This indicator was the highest - 39 in 2010, and the lowest 0 in 2004. The trend for casualties per 1,000 fires is declining. Compared to the state value the number of casualties per 1,000 fires is about the same.
 30.3% incidents where reported in the morning and 69.7% in the evening. The most fires (15.2%) took place on Monday, and the least (12.8%) on Friday.
 Based on the 3,962 reports from years 2002 - 2018 most fires (11.5%) took place during April, and the least (6.0%) in February.
 Out of all 44,464 cases reported during the years 2002 - 2018, the most belonged to the categories: Rescue & EMS (56.5%), Hazardous Condition (10.8%), and False Alarm (9.6%).
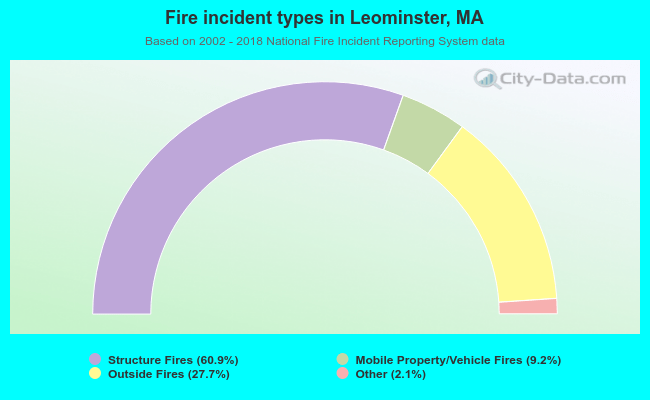 When looking into fire subcategories, the most reports belonged to: Structure Fires (60.9%), and Outside Fires (27.7%).