Lochbuie: Fire Incidents, Colorado (CO)
Where are fire incidents reported in Lochbuie, CO
Something went wrong! Please refresh the page.
|
| |||||||||||||||||||||||||||||||||||||||||||||||||||||||||||||||||||||||||||||||||||||||||||||||||||||||||||||
2008 - 2018 National Fire Incident Reporting System (NFIRS) incidents
- Incident types reported to NFIRS in Lochbuie, CO
- 1,43365.0%Rescue & EMS
- 28813.1%Good Intent Call
- 1577.1%Fire
- 1145.2%Service Call
- 1064.8%Hazardous Condition
- 934.2%False Alarm
- 120.5%Special Incident
- Fire incident types reported to NFIRS in Lochbuie, CO
- 7749.0%Outside Fires
- 5031.8%Structure Fires
- 1912.1%Mobile Property/Vehicle Fires
- 117.0%Other
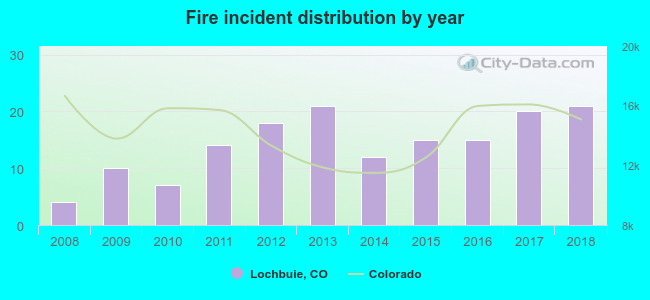 According to the data from the years 2008 - 2018 the average number of fire incidents per year is 14. The highest number of reported fire incidents - 21 took place in 2013, and the least - 4 in 2008. The data has a rising trend.
The average number of yearly fire incidents per 10k residents in Lochbuie, CO compared to nearest cities:
(Note: Based on data for the last 3 years, including only cities with population 5,000 and above)
| Lochbuie: | 35.2 |
| Brighton: | 35.8 |
| Fort Lupton: | 77.9 |
| Firestone: | 34.4 |
| Thornton: | 21.3 |
| Frederick: | 21.7 |
| Commerce City: | 24.8 |
| Northglenn: | 25.4 |
| Welby: | 0.7 |

 24.2% incidents where reported in the morning and 75.8% in the evening. The most fires (17.8%) took place on Wednesday, and the least (8.9%) on Friday.
 Based on the 157 fires from years 2008 - 2018 most fires (13.4%) took place during July, and the least (1.9%) in December.
 Out of all 2,203 cases reported during the years 2008 - 2018, the most belonged to the categories: Overpressure Rupture (65.0%), Service Call (13.1%), and Fire (7.1%).
 When looking into fire subcategories, the most incidents belonged to: Outside Fires (49.0%), and Structure Fires (31.8%).