Logan: Fire Incidents, Utah (UT)
Where are fire incidents reported in Logan, UT
Something went wrong! Please refresh the page.
| Fire incidents reported | |
|---|---|
| Sreet name | Count |
| 200 | 132 |
| 400 | 96 |
| 300 | 90 |
| MAIN ST | 82 |
| MAIN | 78 |
| 600 | 66 |
| 100 | 64 |
| 500 | 58 |
| 900 | 50 |
| 1000 | 40 |
| 1400 | 38 |
| 700 | 38 |
| CENTER ST | 38 |
| 1600 | 28 |
| 1100 | 18 |
| 1200 | 18 |
| 800 | 18 |
| CANYON RD | 16 |
| CENTER | 16 |
| RIVERWALK | 16 |
| 1800 | 14 |
| 200 E | 14 |
| 200 N | 14 |
| US 8991 | 14 |
| 1000 N | 12 |
| 200 NORTH | 12 |
| 400 W | 12 |
| 240 | 10 |
| 250 | 10 |
| 400 S | 10 |
2002 - 2018 National Fire Incident Reporting System (NFIRS) incidents
- Incident types reported to NFIRS in Logan, UT
- 11,52571.7%Rescue & EMS
- 1,4849.2%False Alarm
- 1,0886.8%Fire
- 8345.2%Hazardous Condition
- 8275.1%Good Intent Call
- 2431.5%Service Call
- 420.3%Special Incident
- 300.2%Overpressure Rupture
- Fire incident types reported to NFIRS in Logan, UT
- 55951.4%Structure Fires
- 29226.8%Outside Fires
- 12211.2%Mobile Property/Vehicle Fires
- 11510.6%Other
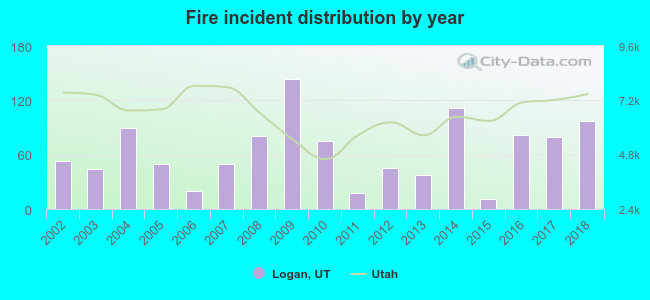 According to the data from the years 2002 - 2018 the average number of fires per year is 64. The highest number of reported fire incidents - 144 took place in 2009, and the least - 11 in 2015. The data has a rising trend.
The average number of yearly fire incidents per 10k residents in Logan, UT compared to nearest cities:
(Note: Based on data for the last 3 years, including only cities with population 5,000 and above)
| Logan: | 17.6 |
| Providence: | 14.6 |
| North Logan: | 20.9 |
| Nibley: | 16.2 |
| Smithfield: | 17.3 |
| Hyrum: | 19.2 |
| Tremonton: | 32.6 |
| Brigham City: | 24.9 |
| Pleasant View: | 26.4 |
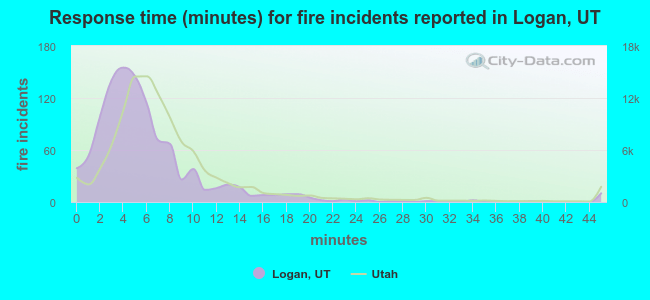 The median response time based on all reported fire incidents is 5 minutes. This is lower than the state median value.
The median response time in Logan, UT compared to nearest cities:
(Note: Based on data for all years, including only cities with at least 500 fire incidents)
| Logan: | 5 minutes |
| Brigham City: | 6 minutes |
| Ogden: | 6 minutes |
| West Haven: | 7 minutes |
| Riverdale: | 6 minutes |
| Roy: | 6 minutes |
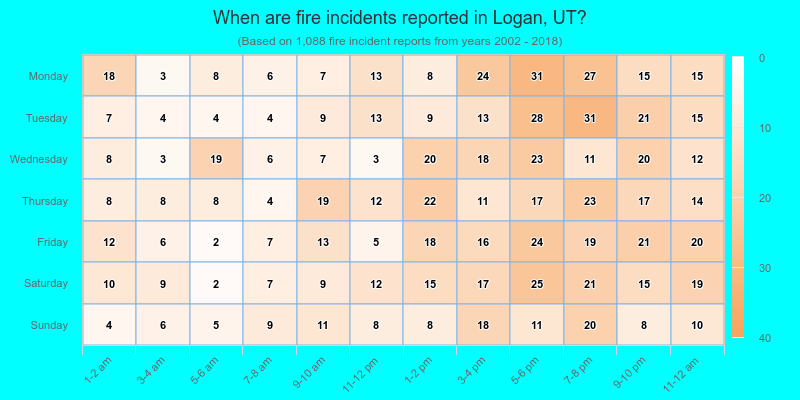
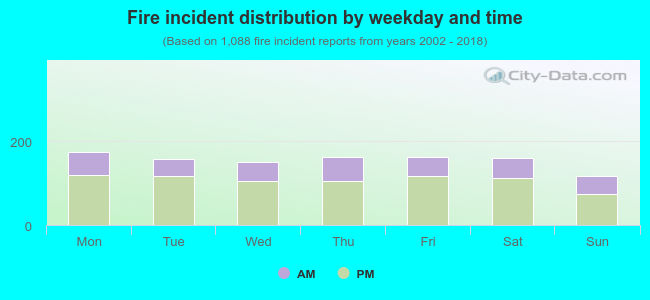 31.1% incidents where reported in the morning and 68.9% in the evening. The most fires (16.1%) took place on Monday, and the least (10.8%) on Sunday.
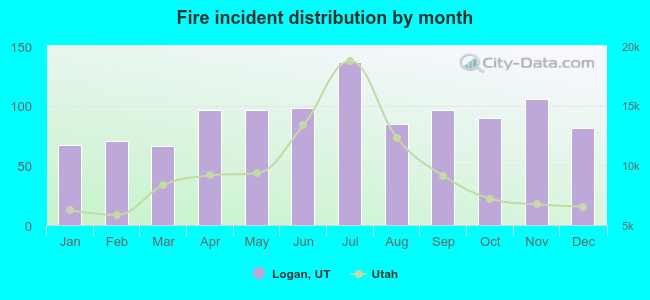 According to the 1,088 incident reports from years 2002 - 2018 most fires (12.6%) took place during July, and the least (6.1%) in March.
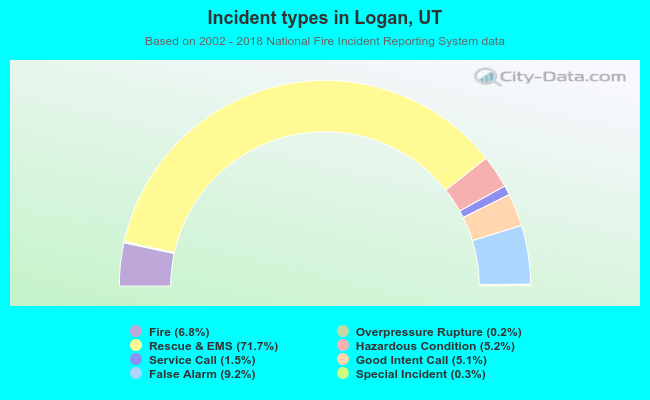 Out of all 16,073 cases reported during the years 2002 - 2018, the most belonged to the categories: Rescue & EMS (71.7%), False Alarm (9.2%), and Fire (6.8%).
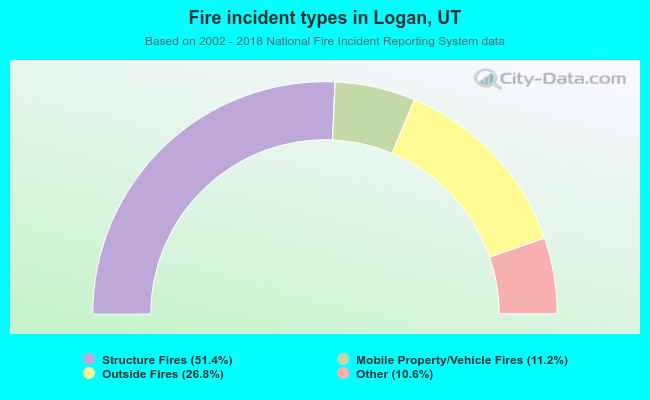 When looking into fire subcategories, the most incidents belonged to: Structure Fires (51.4%), and Outside Fires (26.8%).