Longmont: Fire Incidents, Colorado (CO)
Where are fire incidents reported in Longmont, CO
Something went wrong! Please refresh the page.
| Fire incidents reported | |
|---|---|
| Sreet name | Count |
| MAIN ST | 276 |
| 107TH ST | 126 |
| COUNTY LINE RD | 108 |
| COLLYER ST | 106 |
| MARTIN ST | 104 |
| KEN PRATT BLVD | 94 |
| COFFMAN ST | 84 |
| HOVER ST | 72 |
| NIWOT RD | 68 |
| ROGERS RD | 66 |
| TURNER BLVD | 62 |
| EMERY ST | 60 |
| HWY 119 | 60 |
| KIMBARK ST | 60 |
| SUNSET ST | 58 |
| UTE HWY | 58 |
| 3RD AVE | 56 |
| 9TH AVE | 56 |
| OXFORD RD | 54 |
| 17TH AVE | 52 |
| NELSON RD | 52 |
| SUGARMILL RD | 52 |
| DIAGONAL HWY | 50 |
| TERRY ST | 50 |
| WCR 1 RD | 50 |
| AIRPORT RD | 48 |
| I-25 | 48 |
| ALPINE ST | 46 |
| 115TH ST | 44 |
| HWY 66 | 42 |
| Other | 1,024 |
2004 - 2018 National Fire Incident Reporting System (NFIRS) incidents
- Incident types reported to NFIRS in Longmont, CO
- 23,00055.0%Rescue & EMS
- 5,10612.2%Hazardous Condition
- 4,35610.4%Service Call
- 3,7088.9%Good Intent Call
- 3,1867.6%Fire
- 2,3675.7%False Alarm
- 470.1%Special Incident
- Fire incident types reported to NFIRS in Longmont, CO
- 1,45945.8%Outside Fires
- 91728.8%Structure Fires
- 45114.2%Other
- 35911.3%Mobile Property/Vehicle Fires
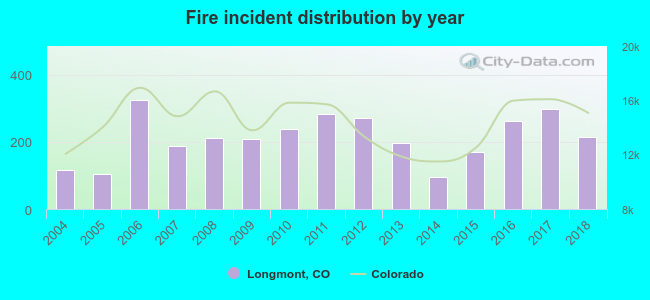 According to the data from the years 2004 - 2018 the average number of fire incidents per year is 212. The highest number of fires - 324 took place in 2006, and the least - 96 in 2014. The data has a rising trend.
The average number of yearly fire incidents per 10k residents in Longmont, CO compared to nearest cities:
(Note: Based on data for the last 3 years, including only cities with population 5,000 and above)
| Longmont: | 28.6 |
| Gunbarrel: | 7.6 |
| Frederick: | 21.7 |
| Erie: | 26.0 |
| Berthoud: | 96.4 |
| Firestone: | 34.4 |
| Lafayette: | 23.8 |
| Boulder: | 32.8 |
| Louisville: | 17.1 |
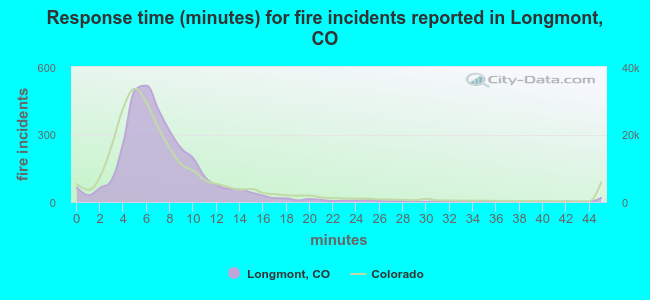 The median response time based on all reported fire incidents is 7 minutes. This is similar to the Colorado median value.
The median response time in Longmont, CO compared to nearest cities:
(Note: Based on data for all years, including only cities with at least 500 fire incidents)
| Longmont: | 7 minutes |
| Erie: | 7 minutes |
| Berthoud: | 9 minutes |
| Lafayette: | 5 minutes |
| Boulder: | 6 minutes |
| Johnstown: | 9 minutes |
| Platteville: | 9 minutes |
| Loveland: | 6 minutes |
| Broomfield: | 6 minutes |
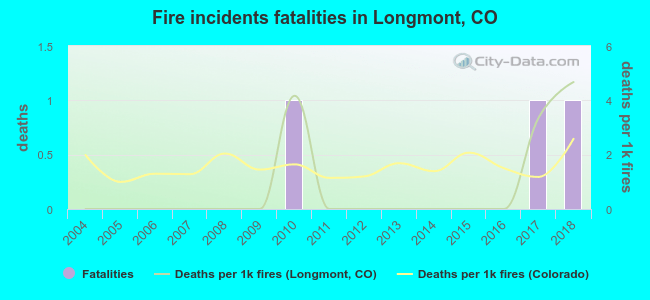 Based on the reports from the years 2004 - 2018 the average number of fire-related fatalities per year is 0. The highest number of deaths - 1 took place in 2010, and the lowest - 0 in 2004. The data has a rising trend.
The average number of fatalities per 1,000 fire incidents is 1. This indicator was the highest - 5 in 2018, and the lowest 0 in 2004. The trend for deaths per 1,000 fire incidents is increasing. Compared to the Colorado value the number of deaths per 1,000 fires is lower.
Based on the reports from the years 2004 - 2018 the average number of fire-related fatalities per year is 0. The highest number of deaths - 1 took place in 2010, and the lowest - 0 in 2004. The data has a rising trend.
The average number of fatalities per 1,000 fire incidents is 1. This indicator was the highest - 5 in 2018, and the lowest 0 in 2004. The trend for deaths per 1,000 fire incidents is increasing. Compared to the Colorado value the number of deaths per 1,000 fires is lower.Deaths per 1,000 incidents in Longmont, CO compared to nearest cities:
(Note: Based on data for all years, including only cities with at least 2,500 fire incidents)
| Longmont: | 0.9 |
| Boulder: | 1.7 |
| Loveland: | 2.9 |
| Thornton: | 1.4 |
| Westminster: | 4.5 |
| Arvada: | 3.3 |
| Greeley: | 2.0 |
| Fort Collins: | 1.0 |
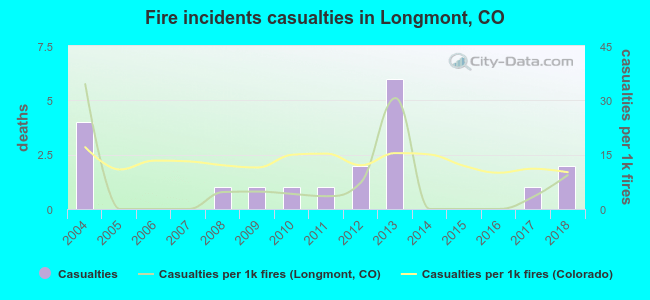 According to the reports from the years 2004 - 2018 the average number of fire-related casualties per year is 1. The highest number of injuries - 6 took place in 2013, and the lowest - 0 in 2005. The data has a decreasing trend.
The average number of casualties per 1,000 fires is 7. This indicator was the highest - 34 in 2004, and the lowest 0 in 2005. The trend for casualties per 1,000 fire incidents is decreasing. Compared to the Colorado value the number of injuries per 1,000 incidents is much lower.
According to the reports from the years 2004 - 2018 the average number of fire-related casualties per year is 1. The highest number of injuries - 6 took place in 2013, and the lowest - 0 in 2005. The data has a decreasing trend.
The average number of casualties per 1,000 fires is 7. This indicator was the highest - 34 in 2004, and the lowest 0 in 2005. The trend for casualties per 1,000 fire incidents is decreasing. Compared to the Colorado value the number of injuries per 1,000 incidents is much lower.Casualties per 1,000 incidents in Longmont, CO compared to nearest cities:
(Note: Based on data for all years, including only cities with at least 500 fire incidents)
| Longmont: | 6.0 |
| Erie: | 4.6 |
| Berthoud: | 2.3 |
| Lafayette: | 5.1 |
| Boulder: | 10.5 |
| Johnstown: | 1.6 |
| Platteville: | 0.0 |
| Loveland: | 13.7 |
| Broomfield: | 11.7 |
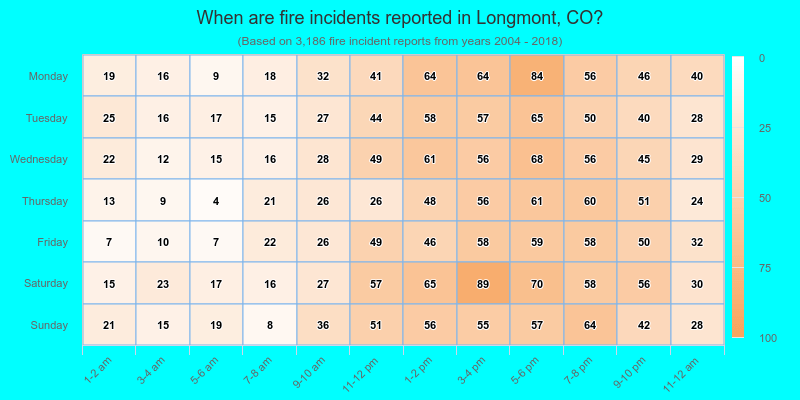
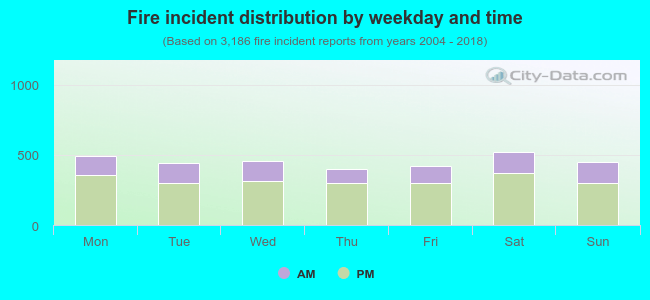 29.7% incidents where reported in the morning and 70.3% in the evening. The most fires (16.4%) took place on Saturday, and the least (12.5%) on Thursday.
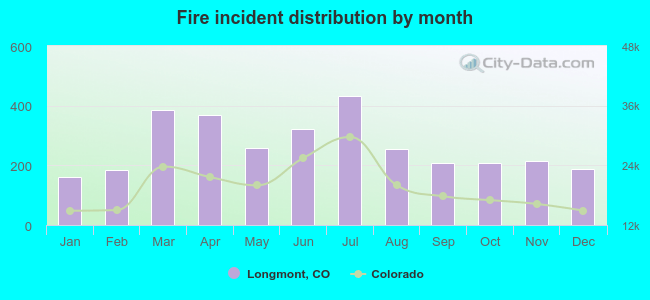 According to the 3,186 fire incidents from years 2004 - 2018 most fires (13.6%) took place during July, and the least (5.1%) in January.
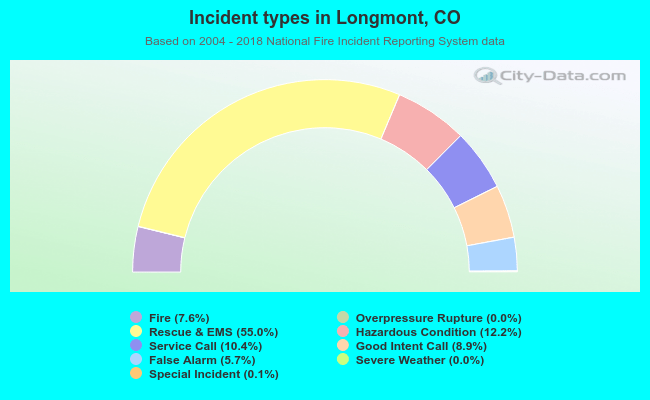 Out of all 41,798 cases reported during the years 2004 - 2018, the most belonged to the categories: Rescue & EMS (55.0%), Hazardous Condition (12.2%), and Service Call (10.4%).
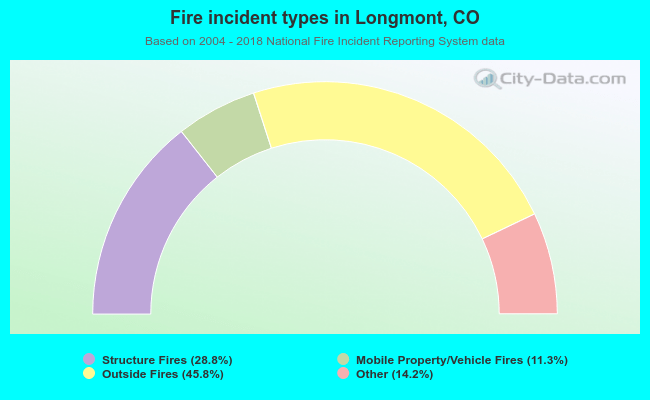 When looking into fire subcategories, the most reports belonged to: Outside Fires (45.8%), and Structure Fires (28.8%).