Luling: Fire Incidents, Louisiana (LA)
Where are fire incidents reported in Luling, LA
Something went wrong! Please refresh the page.
|
| |||||||||||||||||||||||||||||||||||||||||||||||||||||||||||||||||||||||||||||||||||||||||||||||||||||||||||||
2002 - 2018 National Fire Incident Reporting System (NFIRS) incidents
- Incident types reported to NFIRS in Luling, LA
- 55625.0%Fire
- 51723.2%Hazardous Condition
- 46120.7%Good Intent Call
- 31414.1%Rescue & EMS
- 30313.6%False Alarm
- 642.9%Service Call
- 90.4%Special Incident
- Fire incident types reported to NFIRS in Luling, LA
- 21739.0%Structure Fires
- 20436.7%Outside Fires
- 9316.7%Mobile Property/Vehicle Fires
- 427.6%Other
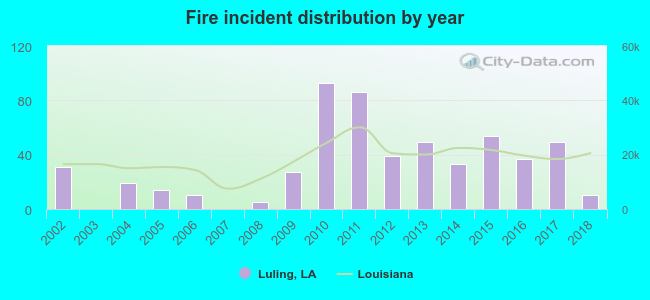 Based on the data from the years 2002 - 2018 the average number of fires per year is 33. The highest number of reported fire incidents - 93 took place in 2010, and the least - 0 in 2003. The data has a decreasing trend.
The average number of yearly fire incidents per 10k residents in Luling, LA compared to nearest cities:
(Note: Based on data for the last 3 years, including only cities with population 5,000 and above)
| Luling: | 26.4 |
| Destrehan: | 33.5 |
| Waggaman: | 26.3 |
| River Ridge: | 15.3 |
| Kenner: | 25.8 |
| Harahan: | 3.9 |
| Bridge City: | 23.4 |
| Metairie: | 15.6 |
| Jefferson: | 47.1 |
 The median response time based on all reported fire incidents is 7 minutes. This is similar to the Louisiana median value.
The median response time in Luling, LA compared to nearest cities:
(Note: Based on data for all years, including only cities with at least 500 fire incidents)
| Luling: | 7 minutes |
| Kenner: | 6 minutes |
| Avondale: | 3 minutes |
| Metairie: | 4 minutes |
| Jefferson: | 4 minutes |
| Westwego: | 2 minutes |
| Laplace: | 6 minutes |
| Reserve: | 5 minutes |
| Marrero: | 4 minutes |
 36.9% incidents where reported in the morning and 63.1% in the evening. The most fires (17.4%) took place on Thursday, and the least (12.1%) on Friday.
 Based on the 556 fire incident reports from years 2002 - 2018 most fires (12.1%) took place during March, and the least (5.2%) in August.
 Out of all 2,226 cases reported during the years 2002 - 2018, the most belonged to the categories: Fire (25.0%), Hazardous Condition (23.2%), and Good Intent Call (20.7%).
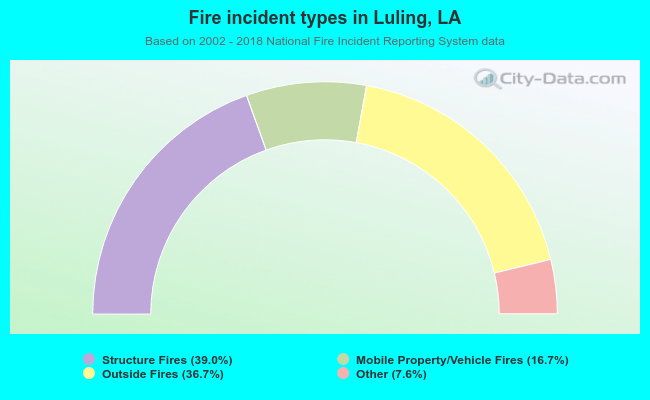 When looking into fire subcategories, the most reports belonged to: Structure Fires (39.0%), and Outside Fires (36.7%).