Mandeville: Fire Incidents, Louisiana (LA)
Where are fire incidents reported in Mandeville, LA
Something went wrong! Please refresh the page.
| Fire incidents reported | |
|---|---|
| Sreet name | Count |
| HWY 190 | 190 |
| HWY 59 | 190 |
| HWY 22 | 128 |
| CAUSEWAY BLVD | 126 |
| HWY 1088 | 102 |
| FLORIDA ST | 82 |
| DESTIN ST | 72 |
| RAPATEL ST | 62 |
| STRAIN RD | 48 |
| MARIGNY AVE | 44 |
| SHARP RD | 44 |
| SOULT ST | 44 |
| COFFEE ST | 40 |
| DUPARD ST | 40 |
| MONROE ST | 40 |
| ORLEANS ST | 38 |
| WOODRIDGE BLVD | 38 |
| AMERICA ST | 36 |
| DOVE PARK RD | 36 |
| WILKINSON ST | 36 |
| BEAU CHENE DR | 34 |
| CLOVER ST | 34 |
| CAROLINE ST | 32 |
| LABARRE ST | 32 |
| MOLITOR ST | 32 |
| ALBERT ST | 30 |
| HICKORY ST | 30 |
| LAFAYETTE ST | 30 |
| LAFITTE ST | 30 |
| CAUSEWAY APPROACH | 28 |
| Other | 1,187 |
2002 - 2018 National Fire Incident Reporting System (NFIRS) incidents
- Incident types reported to NFIRS in Mandeville, LA
- 18,46662.8%Rescue & EMS
- 2,93510.0%Fire
- 2,2937.8%Service Call
- 2,1467.3%Good Intent Call
- 1,9366.6%False Alarm
- 1,5165.2%Hazardous Condition
- 450.2%Severe Weather
- 420.1%Special Incident
- 400.1%Overpressure Rupture
- Fire incident types reported to NFIRS in Mandeville, LA
- 1,94666.3%Outside Fires
- 58019.8%Structure Fires
- 35212.0%Mobile Property/Vehicle Fires
- 571.9%Other
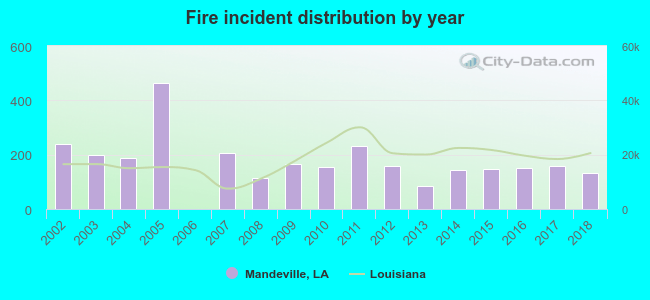 Based on the data from the years 2002 - 2018 the average number of fires per year is 173. The highest number of fires - 462 took place in 2005, and the least - 0 in 2006. The data has a dropping trend.
The average number of yearly fire incidents per 10k residents in Mandeville, LA compared to nearest cities:
(Note: Based on data for the last 3 years, including only cities with population 5,000 and above)
| Mandeville: | 120.4 |
| Covington: | 252.3 |
| Lacombe: | 89.9 |
| Slidell: | 101.5 |
| Ponchatoula: | 170.4 |
| Hammond: | 135.4 |
| Metairie: | 15.6 |
| Kenner: | 25.8 |
| New Orleans: | 17.3 |
 The median response time based on all reported fire incidents is 6 minutes. This is close to the Louisiana median value.
The median response time in Mandeville, LA compared to nearest cities:
(Note: Based on data for all years, including only cities with at least 500 fire incidents)
| Mandeville: | 6 minutes |
| Madisonville: | 7 minutes |
| Covington: | 6 minutes |
| Lacombe: | 7 minutes |
| Slidell: | 6 minutes |
| Folsom: | 7 minutes |
| Pearl River: | 8 minutes |
| Ponchatoula: | 6 minutes |
| Hammond: | 6 minutes |
 According to the data from the years 2002 - 2018 the average number of fire-related casualties per year is 1. The highest number of reported injuries - 6 took place in 2002, and the lowest - 0 in 2006. The data has a declining trend.
The average number of injuries per 1,000 fire incidents is 6. This indicator was the highest - 25 in 2002, and the lowest 0 in 2006. The trend for injuries per 1,000 incidents is dropping. Compared to the Louisiana value the number of injuries per 1,000 fire incidents is higher.
According to the data from the years 2002 - 2018 the average number of fire-related casualties per year is 1. The highest number of reported injuries - 6 took place in 2002, and the lowest - 0 in 2006. The data has a declining trend.
The average number of injuries per 1,000 fire incidents is 6. This indicator was the highest - 25 in 2002, and the lowest 0 in 2006. The trend for injuries per 1,000 incidents is dropping. Compared to the Louisiana value the number of injuries per 1,000 fire incidents is higher.Casualties per 1,000 incidents in Mandeville, LA compared to nearest cities:
(Note: Based on data for all years, including only cities with at least 500 fire incidents)
| Mandeville: | 7.5 |
| Madisonville: | 0.0 |
| Covington: | 8.8 |
| Lacombe: | 1.5 |
| Slidell: | 6.2 |
| Folsom: | 0.0 |
| Pearl River: | 3.2 |
| Ponchatoula: | 2.8 |
| Hammond: | 10.0 |
 26.8% incidents where reported in the morning and 73.2% in the evening. The most fires (18.0%) took place on Saturday, and the least (12.3%) on Wednesday.
 Based on the 2,935 fires from years 2002 - 2018 most fires (11.4%) took place during March, and the least (5.1%) in August.
 Out of all 29,419 cases reported during the years 2002 - 2018, the most belonged to the categories: Rescue & EMS (62.8%), Fire (10.0%), and Service Call (7.8%).
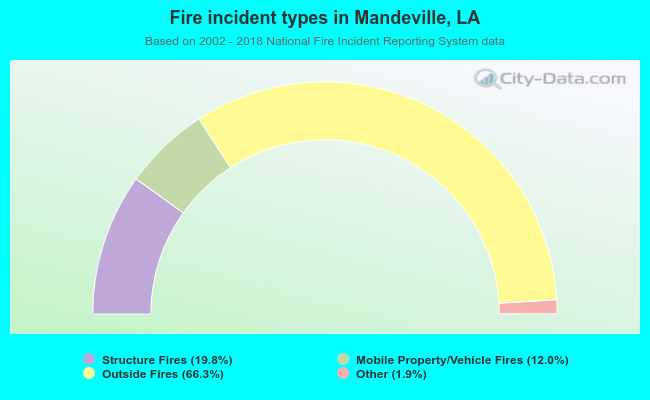 When looking into fire subcategories, the most reports belonged to: Outside Fires (66.3%), and Structure Fires (19.8%).