Lacombe: Fire Incidents, Louisiana (LA)
Where are fire incidents reported in Lacombe, LA
Something went wrong! Please refresh the page.
| Fire incidents reported | |
|---|---|
| Sreet name | Count |
| HWY 190 | 122 |
| HWY 434 | 118 |
| FISH HATCHERY RD | 56 |
| BARRINGER RD | 48 |
| JACKSON ST | 48 |
| PAQUET RD | 42 |
| HIGHWAY 190 | 40 |
| TRANSMITTER RD | 38 |
| LAKE RD | 32 |
| I-12 | 30 |
| I12 | 30 |
| PICHON RD | 30 |
| TRANQUILITY RD | 28 |
| BELL PARK RD | 24 |
| BERRY TODD RD | 24 |
| E BIRCH ST | 22 |
| ELENORE DR | 22 |
| KRENTEL RD | 22 |
| ANNETTE ST | 20 |
| E ELM ST | 20 |
| HIGHWAY 434 | 20 |
| I-12 WEST BOUND | 20 |
| N PONTCHARTRAIN DR | 20 |
| I12 WEST BOUND | 18 |
| I12WESTBOUND | 18 |
| MAY ST | 18 |
| N DIXIE RANCH RD | 18 |
| SYCAMORE DR | 18 |
| MILE MARKER 72 | 16 |
| ROUVILLE RD | 16 |
| Other | 310 |
2002 - 2018 National Fire Incident Reporting System (NFIRS) incidents
- Incident types reported to NFIRS in Lacombe, LA
- 5,06765.8%Rescue & EMS
- 1,30817.0%Fire
- 3995.2%Service Call
- 3704.8%Good Intent Call
- 2693.5%False Alarm
- 2643.4%Hazardous Condition
- 80.1%Special Incident
- Fire incident types reported to NFIRS in Lacombe, LA
- 87166.6%Outside Fires
- 25919.8%Structure Fires
- 16412.5%Mobile Property/Vehicle Fires
- 141.1%Other
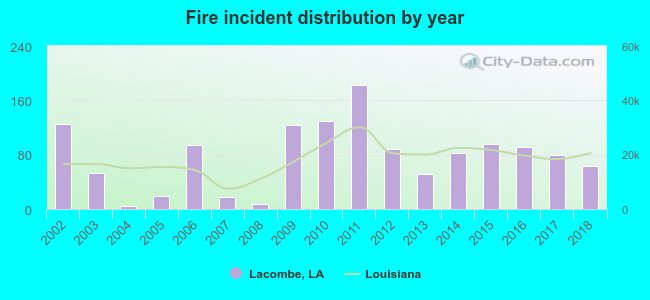 According to the data from the years 2002 - 2018 the average number of fire incidents per year is 77. The highest number of reported fires - 183 took place in 2011, and the least - 5 in 2004. The data has a dropping trend.
The average number of yearly fire incidents per 10k residents in Lacombe, LA compared to nearest cities:
(Note: Based on data for the last 3 years, including only cities with population 5,000 and above)
| Lacombe: | 89.9 |
| Slidell: | 101.5 |
| Mandeville: | 120.4 |
| Covington: | 252.3 |
| New Orleans: | 17.3 |
| Chalmette: | 55.9 |
| Metairie: | 15.6 |
| Meraux: | 44.7 |
| Jefferson: | 47.1 |
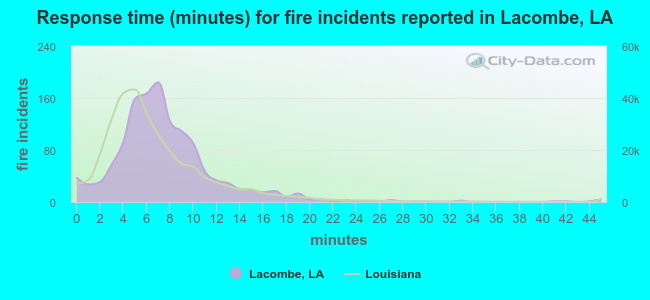 The median response time based on all reported fire incidents is 7 minutes. This is close to the Louisiana median value.
The median response time in Lacombe, LA compared to nearest cities:
(Note: Based on data for all years, including only cities with at least 500 fire incidents)
| Lacombe: | 7 minutes |
| Slidell: | 6 minutes |
| Mandeville: | 6 minutes |
| Pearl River: | 8 minutes |
| Madisonville: | 7 minutes |
| Covington: | 6 minutes |
| New Orleans: | 5 minutes |
| Chalmette: | 4 minutes |
| Metairie: | 4 minutes |
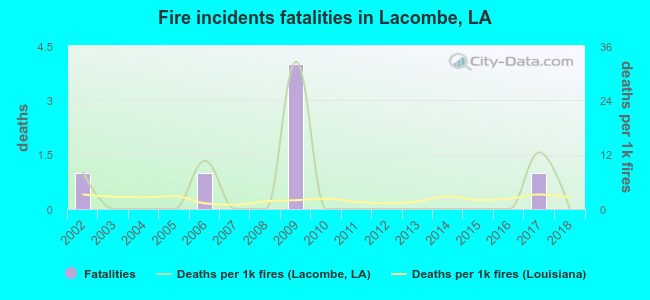 Based on the data from the years 2002 - 2018 the average number of fire-related fatalities per year is 0. The highest number of deaths - 4 took place in 2009, and the lowest - 0 in 2003. The data has a decreasing trend.
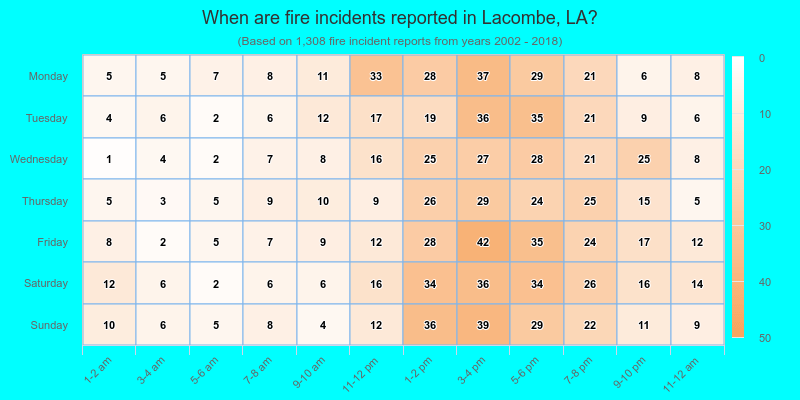
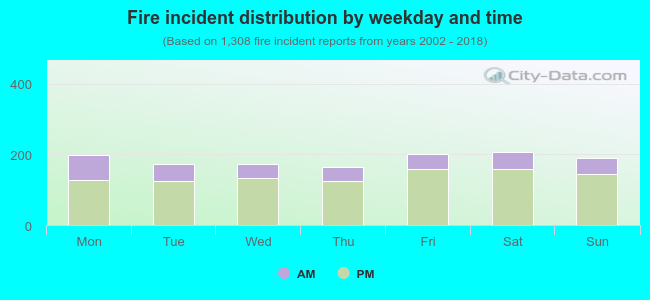 25.3% incidents where reported in the morning and 74.7% in the evening. The most fires (15.9%) took place on Saturday, and the least (12.6%) on Thursday.
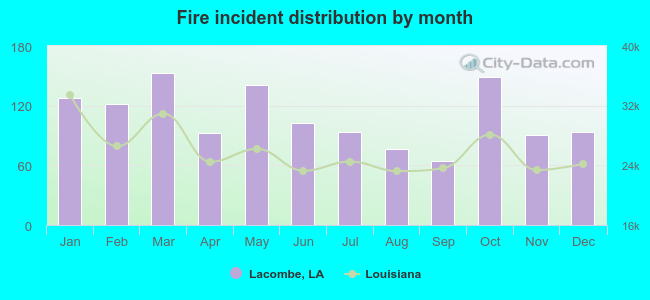 Based on the 1,308 fire incident reports from years 2002 - 2018 most fires (11.7%) took place during March, and the least (4.9%) in September.
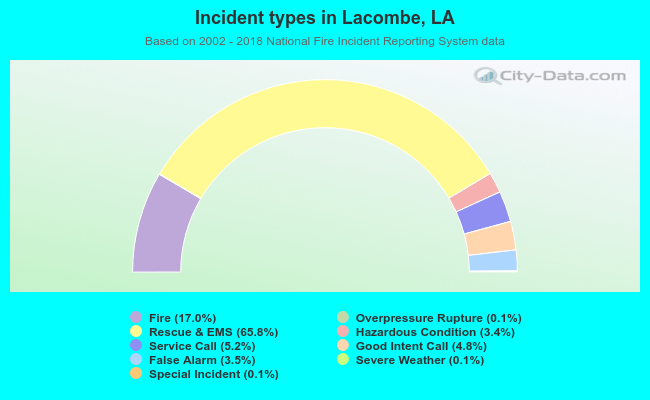 Out of all 7,695 cases reported during the years 2002 - 2018, the most belonged to the categories: Rescue & EMS (65.8%), Fire (17.0%), and Service Call (5.2%).
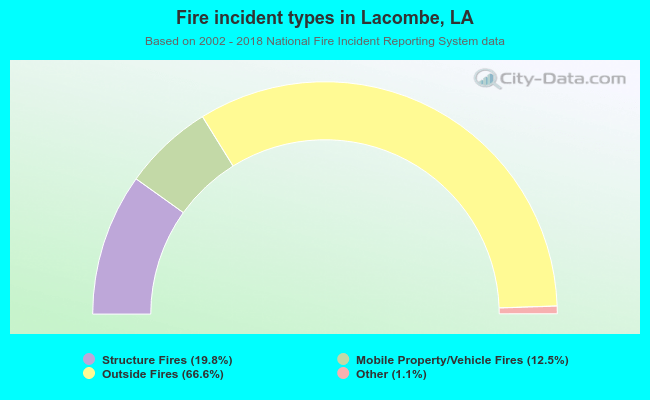 When looking into fire subcategories, the most incidents belonged to: Outside Fires (66.6%), and Structure Fires (19.8%).