Oswego: Fire Incidents, Illinois (IL)
Where are fire incidents reported in Oswego, IL
Something went wrong! Please refresh the page.
| Fire incidents reported | |
|---|---|
| Sreet name | Count |
| RT 34 | 228 |
| DOUGLAS RD | 104 |
| LIGHT RD | 72 |
| WOLF RD | 60 |
| RT 31 | 50 |
| RT 71 | 44 |
| RT 30 | 40 |
| GROVE RD | 36 |
| ORCHARD RD | 36 |
| HARBOR DR | 32 |
| FOX CHASE DR | 28 |
| RESERVATION RD | 28 |
| ROUTE 34 | 28 |
| WASHINGTON ST | 28 |
| RANCE RD | 26 |
| RT 126 | 26 |
| MADISON ST | 24 |
| FARMINGTON LAKES DR | 20 |
| MAIN ST | 20 |
| HARVEY RD | 18 |
| LAKEVIEW DR | 18 |
| ROUTE 30 | 18 |
| WOOLEY RD | 18 |
| BARNABY DR | 16 |
| KENDALL POINT DR | 16 |
| PLAINFIELD RD | 16 |
| ROTH RD | 16 |
| SIMONS RD | 16 |
| STEWART RD | 16 |
| BOULDER HILL PASS | 14 |
| Other | 189 |
2002 - 2018 National Fire Incident Reporting System (NFIRS) incidents
- Incident types reported to NFIRS in Oswego, IL
- 10,08860.8%Rescue & EMS
- 2,07712.5%Hazardous Condition
- 1,76510.6%False Alarm
- 1,3017.8%Fire
- 7434.5%Good Intent Call
- 5553.3%Service Call
- 300.2%Overpressure Rupture
- Fire incident types reported to NFIRS in Oswego, IL
- 64349.4%Outside Fires
- 41932.2%Structure Fires
- 19915.3%Mobile Property/Vehicle Fires
- 403.1%Other
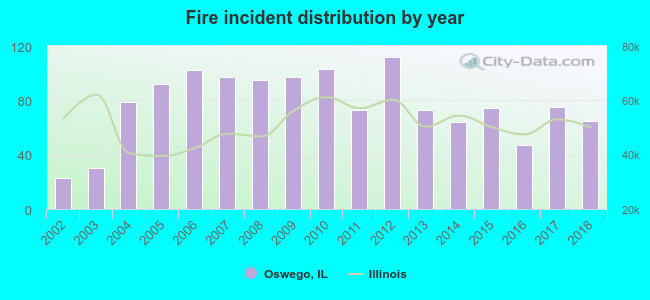 According to the data from the years 2002 - 2018 the average number of fire incidents per year is 77. The highest number of fires - 112 took place in 2012, and the least - 23 in 2002. The data has an increasing trend.
The average number of yearly fire incidents per 10k residents in Oswego, IL compared to nearest cities:
(Note: Based on data for the last 3 years, including only cities with population 5,000 and above)
| Oswego: | 18.8 |
| Montgomery: | 37.0 |
| Aurora: | 11.7 |
| Yorkville: | 42.2 |
| Sugar Grove: | 41.0 |
| North Aurora: | 16.9 |
| Plainfield: | 40.4 |
| Plano: | 31.3 |
| Naperville: | 16.1 |
 The median response time based on all reported fire incidents is 6 minutes. This is similar to the state median value.
The median response time in Oswego, IL compared to nearest cities:
(Note: Based on data for all years, including only cities with at least 500 fire incidents)
| Oswego: | 6 minutes |
| Montgomery: | 6 minutes |
| Aurora: | 5 minutes |
| Yorkville: | 6 minutes |
| Sugar Grove: | 7 minutes |
| North Aurora: | 5 minutes |
| Plainfield: | 6 minutes |
| Plano: | 6 minutes |
| Naperville: | 5 minutes |
 According to the reports from the years 2002 - 2018 the average number of fire-related casualties per year is 1. The highest number of reported casualties - 5 took place in 2017, and the lowest - 0 in 2002. The data has a growing trend.
The average number of injuries per 1,000 fire incidents is 12. This indicator was the highest - 67 in 2017, and the lowest 0 in 2002. The trend for injuries per 1,000 incidents is increasing. Compared to the state value the number of injuries per 1,000 fire incidents is similar.
According to the reports from the years 2002 - 2018 the average number of fire-related casualties per year is 1. The highest number of reported casualties - 5 took place in 2017, and the lowest - 0 in 2002. The data has a growing trend.
The average number of injuries per 1,000 fire incidents is 12. This indicator was the highest - 67 in 2017, and the lowest 0 in 2002. The trend for injuries per 1,000 incidents is increasing. Compared to the state value the number of injuries per 1,000 fire incidents is similar.Casualties per 1,000 incidents in Oswego, IL compared to nearest cities:
(Note: Based on data for all years, including only cities with at least 500 fire incidents)
| Oswego: | 12.3 |
| Montgomery: | 20.3 |
| Aurora: | 14.2 |
| Yorkville: | 15.6 |
| Sugar Grove: | 4.3 |
| North Aurora: | 0.0 |
| Plainfield: | 8.0 |
| Plano: | 0.0 |
| Naperville: | 23.5 |
 28.4% incidents where reported in the morning and 71.6% in the evening. The most fires (15.7%) took place on Sunday, and the least (13.5%) on Friday.
 Based on the 1,301 reports from years 2002 - 2018 most fires (14.8%) took place during April, and the least (4.2%) in December.
 Out of all 16,581 cases reported during the years 2002 - 2018, the most belonged to the categories: Rescue & EMS (60.8%), Hazardous Condition (12.5%), and False Alarm (10.6%).
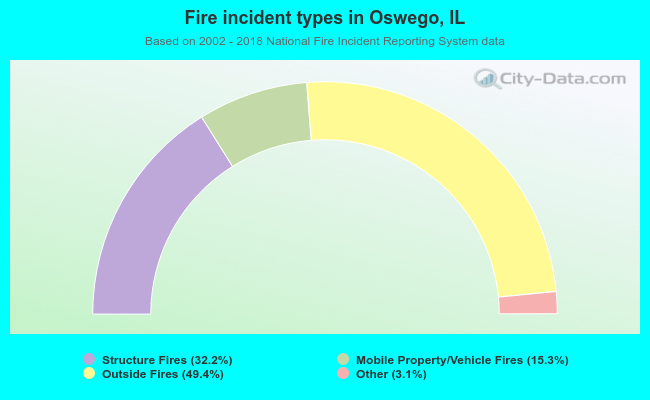 When looking into fire subcategories, the most incidents belonged to: Outside Fires (49.4%), and Structure Fires (32.2%).