Plainfield: Fire Incidents, Illinois (IL)
Where are fire incidents reported in Plainfield, IL
Something went wrong! Please refresh the page.
| Fire incidents reported | |
|---|---|
| Sreet name | Count |
| RT 59 | 186 |
| 135TH ST | 126 |
| RT 30 | 94 |
| LOCKPORT ST | 90 |
| RENWICK RD | 86 |
| ROUTE 59 | 84 |
| VAN DYKE RD | 78 |
| ROUTE 30 | 76 |
| 143RD ST | 70 |
| 119TH ST | 64 |
| MAIN ST | 56 |
| CATON FARM RD | 50 |
| 127TH ST | 46 |
| I-55 | 46 |
| RIDGE RD | 40 |
| CLOW CREEK RD | 38 |
| I55 | 38 |
| ROLF RD | 38 |
| COUNTY LINE RD | 36 |
| HEGGS RD | 36 |
| WHEELER RD | 36 |
| LINCOLN HWY | 34 |
| NAPERVILLE RD | 34 |
| DRAUDEN RD | 32 |
| LILY CACHE RD | 30 |
| BUDLER RD | 28 |
| BLAKELY DR | 26 |
| DIVISION ST | 26 |
| INTERSTATE 55 FWY | 26 |
| MEADOW LN | 24 |
| Other | 839 |
2002 - 2018 National Fire Incident Reporting System (NFIRS) incidents
- Incident types reported to NFIRS in Plainfield, IL
- 20,56958.6%Rescue & EMS
- 4,15411.8%False Alarm
- 2,9338.4%Service Call
- 2,7807.9%Hazardous Condition
- 2,5137.2%Fire
- 2,0505.8%Good Intent Call
- 390.1%Overpressure Rupture
- Fire incident types reported to NFIRS in Plainfield, IL
- 1,08243.1%Structure Fires
- 97238.7%Outside Fires
- 36414.5%Mobile Property/Vehicle Fires
- 953.8%Other
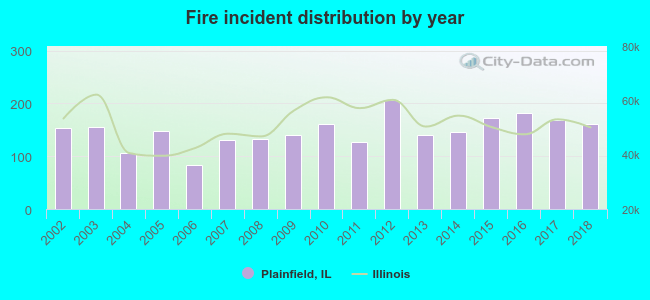 Based on the data from the years 2002 - 2018 the average number of fires per year is 148. The highest number of fire incidents - 206 took place in 2012, and the least - 83 in 2006. The data has a rising trend.
The average number of yearly fire incidents per 10k residents in Plainfield, IL compared to nearest cities:
(Note: Based on data for the last 3 years, including only cities with population 5,000 and above)
| Plainfield: | 40.4 |
| Romeoville: | 31.3 |
| Crest Hill: | 23.6 |
| Shorewood: | 36.6 |
| Joliet: | 28.1 |
| Bolingbrook: | 23.8 |
| Lockport: | 43.1 |
| Oswego: | 18.8 |
| Naperville: | 16.1 |
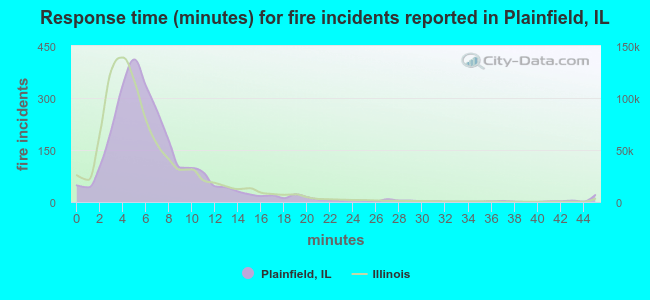 The median response time based on all reported fire incidents is 6 minutes. This is comparable to the Illinois median value.
The median response time in Plainfield, IL compared to nearest cities:
(Note: Based on data for all years, including only cities with at least 500 fire incidents)
| Plainfield: | 6 minutes |
| Romeoville: | 5 minutes |
| Crest Hill: | 5 minutes |
| Shorewood: | 5 minutes |
| Joliet: | 5 minutes |
| Bolingbrook: | 5 minutes |
| Lockport: | 5 minutes |
| Oswego: | 6 minutes |
| Naperville: | 5 minutes |
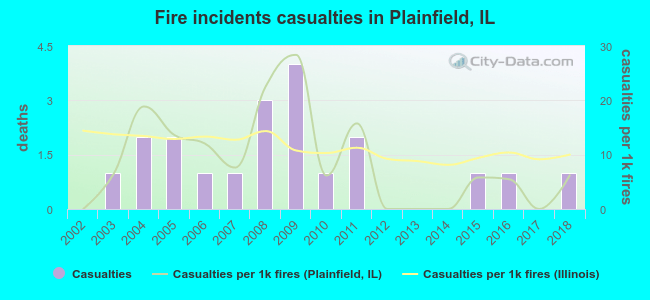 According to the reports from the years 2002 - 2018 the average number of fire-related casualties per year is 1. The highest number of casualties - 4 took place in 2009, and the lowest - 0 in 2002. The data has a growing trend.
The average number of casualties per 1,000 fires is 9. This indicator was the highest - 28 in 2009, and the lowest 0 in 2002. The trend for injuries per 1,000 incidents is growing. Compared to the state value the number of casualties per 1,000 incidents is lower.
According to the reports from the years 2002 - 2018 the average number of fire-related casualties per year is 1. The highest number of casualties - 4 took place in 2009, and the lowest - 0 in 2002. The data has a growing trend.
The average number of casualties per 1,000 fires is 9. This indicator was the highest - 28 in 2009, and the lowest 0 in 2002. The trend for injuries per 1,000 incidents is growing. Compared to the state value the number of casualties per 1,000 incidents is lower.Casualties per 1,000 incidents in Plainfield, IL compared to nearest cities:
(Note: Based on data for all years, including only cities with at least 500 fire incidents)
| Plainfield: | 8.0 |
| Romeoville: | 12.2 |
| Crest Hill: | 11.5 |
| Shorewood: | 7.2 |
| Joliet: | 4.2 |
| Bolingbrook: | 20.8 |
| Lockport: | 16.0 |
| Oswego: | 12.3 |
| Naperville: | 23.5 |
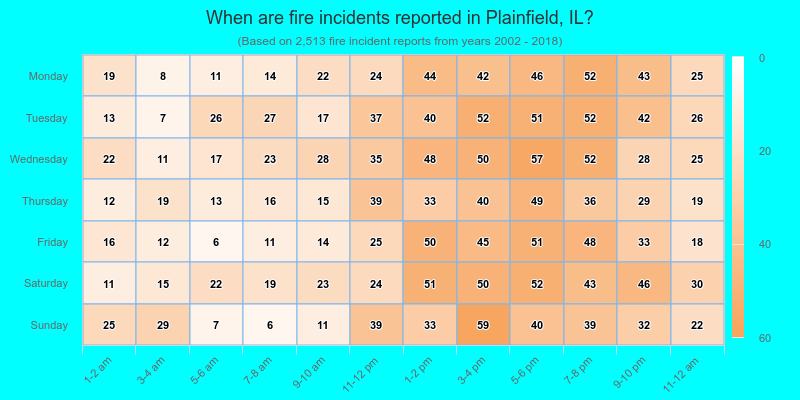
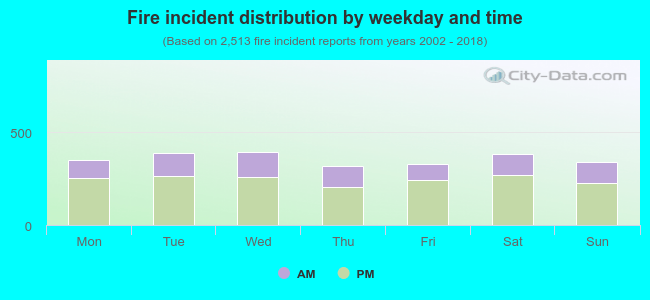 31.4% incidents where reported in the morning and 68.6% in the evening. The most fires (15.8%) took place on Wednesday, and the least (12.7%) on Thursday.
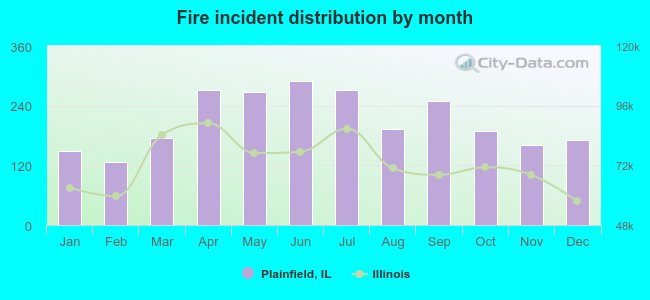 According to the 2,513 incident reports from years 2002 - 2018 most fires (11.5%) took place during June, and the least (5.1%) in February.
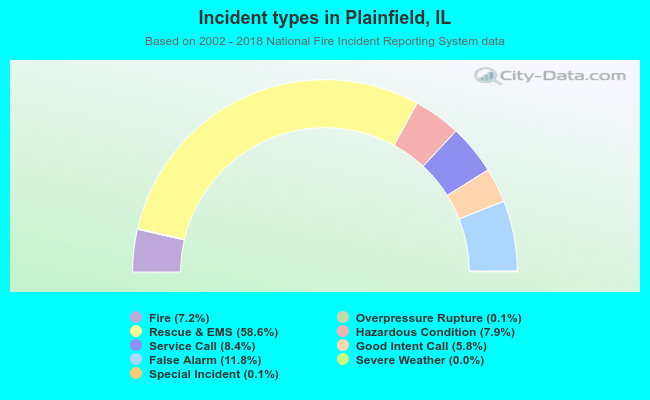 Out of all 35,079 cases reported during the years 2002 - 2018, the most belonged to the categories: Rescue & EMS (58.6%), False Alarm (11.8%), and Service Call (8.4%).
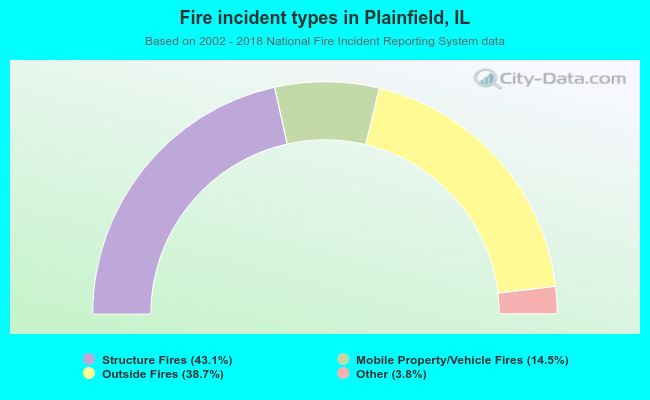 When looking into fire subcategories, the most reports belonged to: Structure Fires (43.1%), and Outside Fires (38.7%).