Scituate: Fire Incidents, Massachusetts (MA)
Where are fire incidents reported in Scituate, MA
Something went wrong! Please refresh the page.
| Fire incidents reported | |
|---|---|
| Sreet name | Count |
| COUNTRY WAY | 102 |
| DRIFTWAY | 98 |
| FIRST PARISH RD | 90 |
| FRONT ST | 74 |
| CHIEF JUSTICE CUSHING WAY | 68 |
| HATHERLY RD | 64 |
| STOCKBRIDGE RD | 64 |
| GANNETT RD | 52 |
| CENTRAL AVE | 50 |
| CLAPP RD | 44 |
| GLADES RD | 44 |
| TILDEN RD | 44 |
| TURNER RD | 44 |
| WHEELER PARK | 36 |
| BORDER ST | 32 |
| CENTRAL PARK DR | 32 |
| OCEANSIDE DR | 32 |
| JERICHO RD | 28 |
| NEW DRIFTWAY | 28 |
| OLD OAKEN BUCKET RD | 28 |
| SURFSIDE RD | 26 |
| BEAVER DAM RD | 24 |
| EDWARD FOSTER RD | 24 |
| HENRY TURNER BAILEY RD | 20 |
| LAWSON RD | 20 |
| LIGHTHOUSE RD | 20 |
| RIVER ST | 20 |
| COLE PKY | 18 |
| MARION RD | 18 |
| BRANCH ST | 16 |
| Other | 85 |
2002 - 2018 National Fire Incident Reporting System (NFIRS) incidents
- Incident types reported to NFIRS in Scituate, MA
- 9,33350.7%Rescue & EMS
- 3,63219.7%Hazardous Condition
- 1,5408.4%Service Call
- 1,5078.2%False Alarm
- 1,3457.3%Fire
- 9145.0%Good Intent Call
- 660.4%Special Incident
- 540.3%Severe Weather
- 230.1%Overpressure Rupture
- Fire incident types reported to NFIRS in Scituate, MA
- 61245.5%Structure Fires
- 53539.8%Outside Fires
- 1138.4%Mobile Property/Vehicle Fires
- 856.3%Other
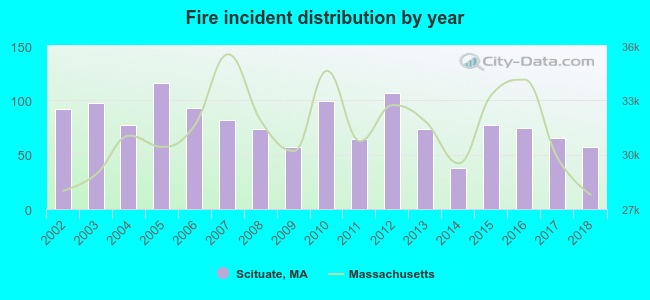 According to the data from the years 2002 - 2018 the average number of fires per year is 79. The highest number of fire incidents - 116 took place in 2005, and the least - 38 in 2014. The data has a declining trend.
The average number of yearly fire incidents per 10k residents in Scituate, MA compared to nearest cities:
(Note: Based on data for the last 3 years, including only cities with population 5,000 and above)
| Scituate: | 125.2 |
| Norwell: | 40.0 |
| Cohasset: | 92.4 |
| Hanover: | 38.7 |
| Hingham: | 140.4 |
| Pembroke: | 3.6 |
| Hull: | 24.6 |
| Rockland: | 46.9 |
| Weymouth: | 50.1 |
 The median response time based on all reported fire incidents is 4 minutes. This is comparable to the state median value.
The median response time in Scituate, MA compared to nearest cities:
(Note: Based on data for all years, including only cities with at least 500 fire incidents)
| Scituate: | 4 minutes |
| Norwell: | 5 minutes |
| Cohasset: | 6 minutes |
| Marshfield: | 4 minutes |
| Hanover: | 5 minutes |
| Hingham: | 5 minutes |
| Hull: | 3 minutes |
| Rockland: | 3 minutes |
| Hanson: | 5 minutes |
 According to the reports from the years 2002 - 2018 the average number of fire-related fatalities per year is 0. The highest number of reported deaths - 1 took place in 2005, and the lowest - 0 in 2002. The data has a constant trend.
 According to the reports from the years 2002 - 2018 the average number of fire-related casualties per year is 1. The highest number of reported injuries - 5 took place in 2009, and the lowest - 0 in 2003. The data has a declining trend.
The average number of injuries per 1,000 fire incidents is 19. This indicator was the highest - 88 in 2009, and the lowest 0 in 2003. The trend for injuries per 1,000 fire incidents is decreasing. Compared to the state value the number of casualties per 1,000 incidents is higher.
According to the reports from the years 2002 - 2018 the average number of fire-related casualties per year is 1. The highest number of reported injuries - 5 took place in 2009, and the lowest - 0 in 2003. The data has a declining trend.
The average number of injuries per 1,000 fire incidents is 19. This indicator was the highest - 88 in 2009, and the lowest 0 in 2003. The trend for injuries per 1,000 fire incidents is decreasing. Compared to the state value the number of casualties per 1,000 incidents is higher.
 29.2% incidents where reported in the morning and 70.8% in the evening. The most fires (18.2%) took place on Saturday, and the least (11.9%) on Tuesday.
 According to the 1,345 fire incidents from years 2002 - 2018 most fires (12.9%) took place during July, and the least (4.5%) in October.
 Out of all 18,414 cases reported during the years 2002 - 2018, the most belonged to the categories: Rescue & EMS (50.7%), Hazardous Condition (19.7%), and Service Call (8.4%).
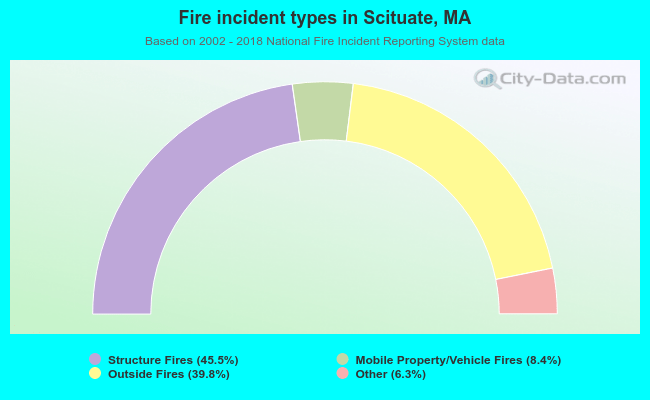 When looking into fire subcategories, the most incidents belonged to: Structure Fires (45.5%), and Outside Fires (39.8%).