Swarthmore: Fire Incidents, Pennsylvania (PA)
Where are fire incidents reported in Swarthmore, PA
Something went wrong! Please refresh the page.
|
| |||||||||||||||||||||||||||||||||||||||||||||||||||||||||||||||||||||||||||||||||||||||||||||||||||||||||||||
2004 - 2018 National Fire Incident Reporting System (NFIRS) incidents
- Incident types reported to NFIRS in Swarthmore, PA
- 45539.9%Hazardous Condition
- 29625.9%Fire
- 15913.9%Good Intent Call
- 12911.3%False Alarm
- 645.6%Rescue & EMS
- 282.5%Service Call
- 70.6%Special Incident
- 20.2%Overpressure Rupture
- Fire incident types reported to NFIRS in Swarthmore, PA
- 22475.7%Structure Fires
- 3511.8%Outside Fires
- 268.8%Other
- 113.7%Mobile Property/Vehicle Fires
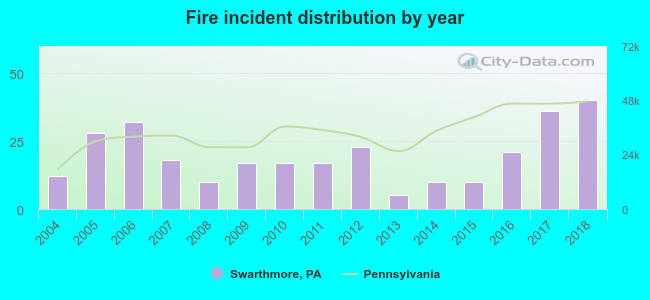 Based on the data from the years 2004 - 2018 the average number of fires per year is 20. The highest number of reported fires - 40 took place in 2018, and the least - 5 in 2013. The data has a rising trend.
The average number of yearly fire incidents per 10k residents in Swarthmore, PA compared to nearest cities:
(Note: Based on data for the last 3 years, including only cities with population 5,000 and above)
| Swarthmore: | 52.1 |
| Folsom: | 28.4 |
| Woodlyn: | 9.5 |
| Springfield: | 14.6 |
| Ridley Park: | 72.5 |
| Prospect Park: | 31.9 |
| Media: | 151.6 |
| Norwood: | 35.0 |
| Glenolden: | 98.5 |
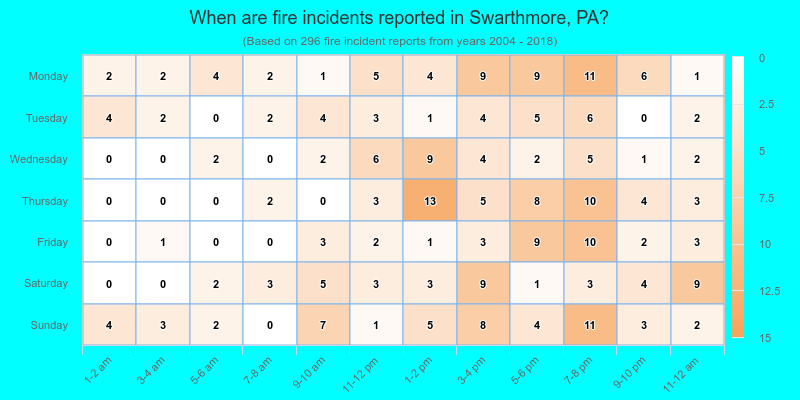
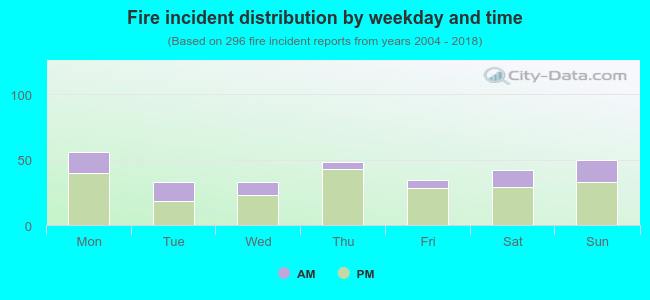 27.7% incidents where reported in the morning and 72.3% in the evening. The most fires (18.9%) took place on Monday, and the least (11.1%) on Tuesday.
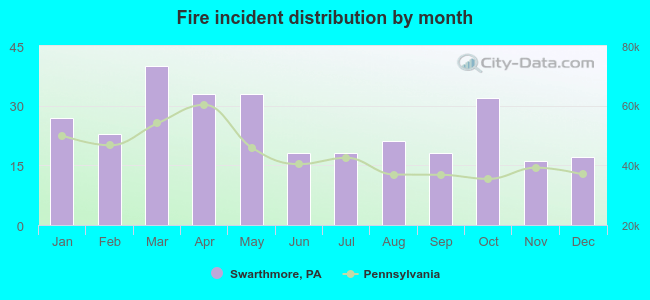 Based on the 296 fire incidents from years 2004 - 2018 most fires (13.5%) took place during March, and the least (5.4%) in November.
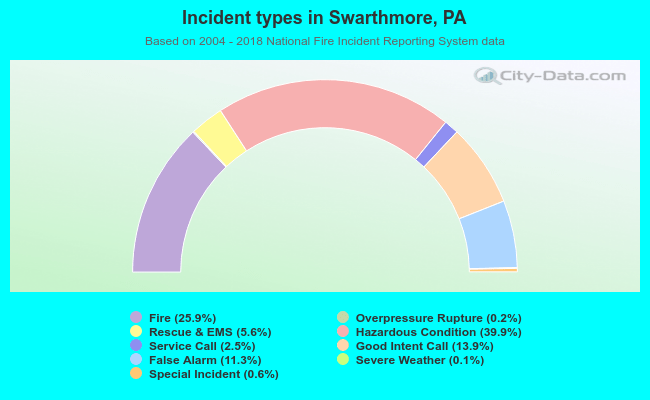 Out of all 1,141 cases reported during the years 2004 - 2018, the most belonged to the categories: Hazardous Condition (39.9%), Fire (25.9%), and Good Intent Call (13.9%).
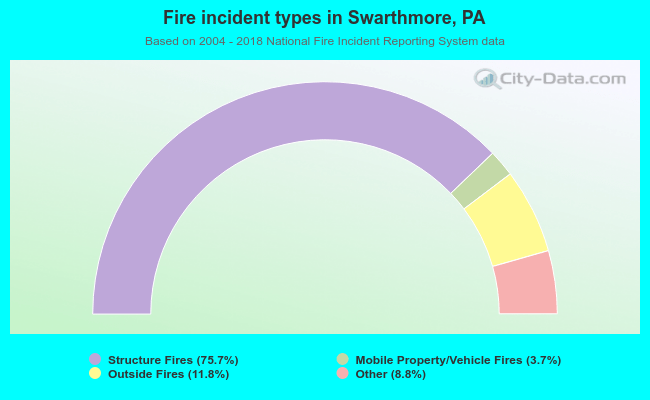 When looking into fire subcategories, the most reports belonged to: Structure Fires (75.7%), and Outside Fires (11.8%).