Media: Fire Incidents, Pennsylvania (PA)
Where are fire incidents reported in Media, PA
Something went wrong! Please refresh the page.
|
| |||||||||||||||||||||||||||||||||||||||||||||||||||||||||||||||||||||||||||||||||||||||||||||||||||||||||||||
2006 - 2018 National Fire Incident Reporting System (NFIRS) incidents
- Incident types reported to NFIRS in Media, PA
- 60534.2%Fire
- 37020.9%Hazardous Condition
- 29216.5%Rescue & EMS
- 22512.7%False Alarm
- 1729.7%Good Intent Call
- 613.4%Special Incident
- 422.4%Service Call
- 20.1%Severe Weather
- Fire incident types reported to NFIRS in Media, PA
- 43772.2%Structure Fires
- 7412.2%Other
- 477.8%Mobile Property/Vehicle Fires
- 477.8%Outside Fires
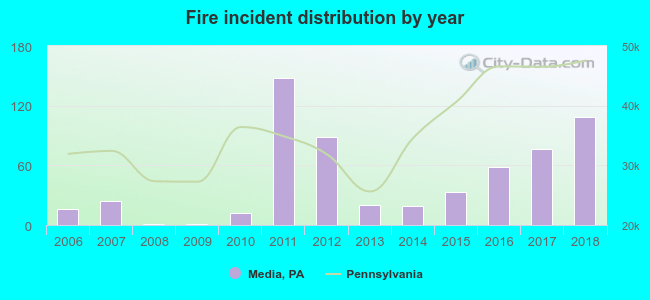 Based on the data from the years 2006 - 2018 the average number of fires per year is 47. The highest number of fire incidents - 148 took place in 2011, and the least - 1 in 2008. The data has an increasing trend.
The average number of yearly fire incidents per 10k residents in Media, PA compared to nearest cities:
(Note: Based on data for the last 3 years, including only cities with population 5,000 and above)
| Media: | 151.6 |
| Swarthmore: | 52.1 |
| Springfield: | 14.6 |
| Brookhaven: | 79.3 |
| Woodlyn: | 9.5 |
| Folsom: | 28.4 |
| Broomall: | 53.4 |
| Ridley Park: | 72.5 |
| Prospect Park: | 31.9 |
 The median response time based on all reported fire incidents is 6 minutes. This is about the same as the Pennsylvania median value.
The median response time in Media, PA compared to nearest cities:
(Note: Based on data for all years, including only cities with at least 500 fire incidents)
| Media: | 6 minutes |
| Brookhaven: | 3 minutes |
| Broomall: | 6 minutes |
| Chester: | 4 minutes |
| Collingdale: | 4 minutes |
| Darby: | 5 minutes |
| Yeadon: | 5 minutes |
| Berwyn: | 8 minutes |
| Claymont: | 6 minutes |
 41.3% incidents where reported in the morning and 58.7% in the evening. The most fires (16.2%) took place on Monday, and the least (12.4%) on Saturday.
 Based on the 605 incident reports from years 2006 - 2018 most fires (12.4%) took place during April, and the least (3.6%) in December.
 Out of all 1,770 cases reported during the years 2006 - 2018, the most belonged to the categories: Fire (34.2%), Hazardous Condition (20.9%), and Rescue & EMS (16.5%).
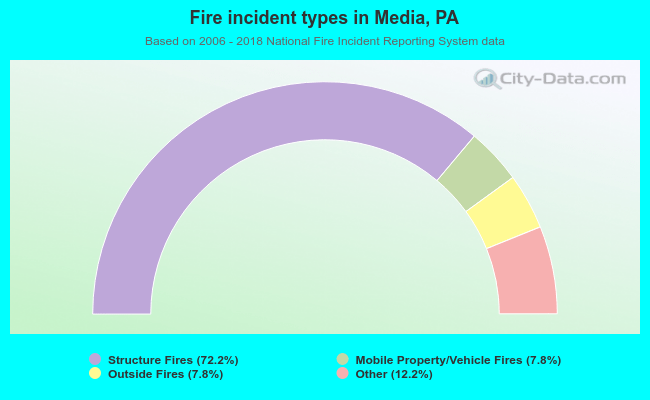 When looking into fire subcategories, the most reports belonged to: Structure Fires (72.2%), and Other (12.2%).