Median price asked for vacant for-sale houses and condos in 2022 in this county: $228,979.
Median contract rent in 2022: $1,084 (lower quartile is $791, upper quartile is $1,525)
Median gross rent in Orwell, VT in 2022: $1,203
Housing units in Orwell with a mortgage: 102 (9 second mortgage, 16 home equity loan, 0 both second mortgage and home equity loan) Houses without a mortgage: 57
In family households: 27,795 (6,422 male householders, 2,918 female householders)
7,510 spouses, 8,926 children (8,175 natural, 336 adopted, 415 stepchildren), 378 grandchildren, 176 brothers or sisters, 192 parents, foster children, 179 other relatives, 914 non-relatives
In nonfamily households: 6,174 (2,298 male householders (1,677 living alone)), 2,446 female householders (1,912 living alone)), 1,430 nonrelatives
In group quarters: 2,852 (163 institutionalized population)
6,630 married couples with children.
1,679 single-parent households (533 men, 1,146 women).
94.6% of residents of Orwell speak English at home.
1.1% of residents speak Spanish at home (100% speak English very well).
4.3% of residents speak other Indo-European language at home (60% speak English very well, 40% speak English well).
Foreign born population: 42 (3.2%)
(95.2% of them are naturalized citizens)
Year of entry for the foreign-born population in Orwell, Vermont
21995 to March 2000
11990 to 1994
21985 to 1989
01980 to 1984
01975 to 1979
21970 to 1974
11965 to 1969
31Before 1965
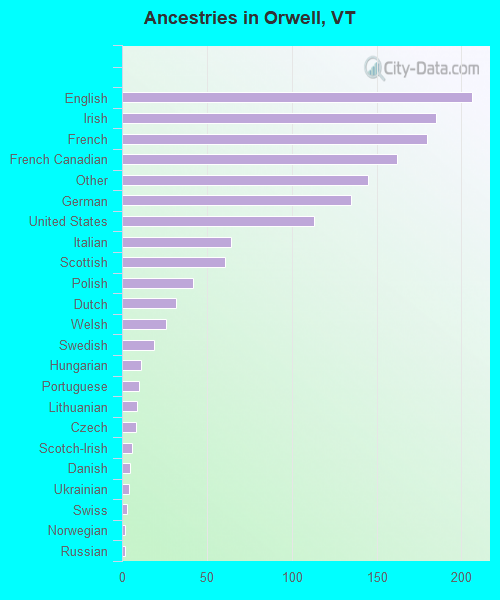
First ancestries reported:
English: 206 (14.4%)
Irish: 185 (12.9%)
French: 180 (12.6%)
French Canadian: 162 (11.3%)
Other: 145 (10.1%)
German: 135 (9.4%)
United States: 113 (7.9%)
Italian: 64 (4.5%)
Scottish: 61 (4.3%)
Polish: 42 (2.9%)
Dutch: 32 (2.2%)
Welsh: 26 (1.8%)
Swedish: 19 (1.3%)
Hungarian: 11 (0.8%)
Portuguese: 10 (0.7%)
Lithuanian: 9 (0.6%)
Czech: 8 (0.6%)
Scotch-Irish: 6 (0.4%)
Danish: 5 (0.3%)
Ukrainian: 4 (0.3%)
Swiss: 3 (0.2%)
Norwegian: 2 (0.1%)
Russian: 2 (0.1%)
Most common places of birth for foreign-born residents (%):
Canada
Orwell:
51.3% (20)
Vermont:
34.0% (7,912)
Germany
Orwell:
15.4% (6)
Vermont:
7.2% (1,669)
United Kingdom
Orwell:
5.1% (2)
Vermont:
7.5% (1,744)
Sweden
Orwell:
5.1% (2)
Vermont:
0.7% (152)
Austria
Orwell:
5.1% (2)
Vermont:
0.8% (191)
France
Orwell:
5.1% (2)
Vermont:
1.7% (400)
Netherlands
Orwell:
5.1% (2)
Vermont:
1.4% (318)
Hungary
Orwell:
5.1% (2)
Vermont:
0.4% (85)
Place of birth for U.S.-born residents:
This state: 710
Other state: 434
Northeast: 317
Midwest: 34
South: 38
West: 45
72% of Orwell residents lived in the same house 5 years ago. Out of people who lived in different houses, 50% lived in this county. Out of people who lived in different counties, 50% lived in Vermont.
Education attainment for males 25 years and older:
No schooling: 3
Nursery to 4th grade: 2
5th and 6th grade: 4
7th and 8th grade: 33
9th grade: 10
10th grade: 17
11th grade: 7
12th grade, no diploma: 5
High school graduate (or equivalency): 164
Less than 1 year of college: 21
Some college more than 1 year, no degree: 22
Associate degree: 26
Bachelor's degree: 47
Master's degree: 20
Professional school degree: 8
Doctorate degree: 1
Education attainment for females 25 years and older:
No schooling: 4
Nursery to 4th grade: 0
5th and 6th grade: 5
7th and 8th grade: 7
9th grade: 4
10th grade: 20
11th grade: 11
12th grade, no diploma: 15
High school graduate (or equivalency): 126
Less than 1 year of college: 32
Some college more than 1 year, no degree: 38
Associate degree: 41
Bachelor's degree: 74
Master's degree: 20
Professional school degree: 4
Doctorate degree: 2
Housing units in structures:
One, detached: 508
One, attached: 4
Two: 8
3 or 4: 3
20 to 49: 2
Mobile homes: 52
Median worth of mobile homes: $172,180
Housing units lacking complete plumbing facilities: 1.9%
Housing units lacking complete kitchen facilities: 0.5%