Paint Lick, KY (Kentucky) Houses and Residents
| Paint Lick: | $162,834 |
| Kentucky: | $196,300 |
Total population: 3,294 (Urban population: 0, Rural population: 2,745 (395 farm, 2,350 nonfarm))
Houses: 1,207 (1,084 occupied: 838 owner occupied, 246 renter occupied)
| % of renters here: | 23% |
| State: | 31% |
Housing density: 15 houses/condos per square mile
Median price asked for vacant for-sale houses and condos in 2022 in this county: $264,169.
Median contract rent in 2022: $498 (lower quartile is $392, upper quartile is $565)
Median rent asked for vacant for-rent units in 2022: $417
Median gross rent in Paint Lick, KY in 2022: $781
Housing units in Paint Lick with a mortgage: 253 (14 second mortgage, 10 home equity loan, 0 both second mortgage and home equity loan)
Houses without a mortgage: 127


Household type by relationship:
Households: 16,803- In family households: 14,672 (3,586 male householders, 1,308 female householders)
3,917 spouses, 4,495 children (4,048 natural, 154 adopted, 293 stepchildren), 452 grandchildren, 120 brothers or sisters, 119 parents, foster children, 181 other relatives, 397 non-relatives
- In nonfamily households: 2,131 (832 male householders (673 living alone)), 942 female householders (818 living alone)), 357 nonrelatives
- In group quarters: 109 (95 institutionalized population)
2,653 married couples with children.
630 single-parent households (128 men, 502 women).
95.7% of residents of Paint Lick speak English at home.
2.7% of residents speak Spanish at home (70% speak English very well, 13% speak English well, 17% speak English not well).
1.6% of residents speak other Indo-European language at home (46% speak English well, 54% speak English not well).
Foreign born population: 54 (1.9%)
(29.6% of them are naturalized citizens)
| Here: | 6.4 |
| State: | 6.4 |
| Here: | 6.2 |
| State: | 4.4 |

- Bedrooms in owner-occupied houses and condos in Paint Lick, Kentucky
- 0no bedroom
- 301 bedroom
- 2812 bedrooms
- 4103 bedrooms
- 1104 bedrooms
- 75+ bedrooms

- Bedrooms in renter-occupied apartments in Paint Lick, Kentucky
- 7no bedroom
- 441 bedroom
- 462 bedrooms
- 1253 bedrooms
- 244 bedrooms
- 05+ bedrooms

- Cars and other vehicles available in Paint Lick in owner-occupied houses/condos
- 48no vehicle
- 1421 vehicle
- 4332 vehicles
- 1353 vehicles
- 744 vehicles
- 65+ vehicles

- Cars and other vehicles available in Paint Lick in renter-occupied apartments
- 15no vehicle
- 1021 vehicle
- 1222 vehicles
- 73 vehicles
- 04 vehicles
- 05+ vehicles

- Rooms in owner-occupied houses in Paint Lick, Kentucky
- 01 room
- 142 rooms
- 83 rooms
- 1524 rooms
- 2305 rooms
- 2106 rooms
- 977 rooms
- 778 rooms
- 509+ rooms

- Rooms in renter-occupied apartments in Paint Lick, Kentucky
- 71 room
- 82 rooms
- 363 rooms
- 314 rooms
- 685 rooms
- 656 rooms
- 237 rooms
- 88 rooms
- 09+ rooms


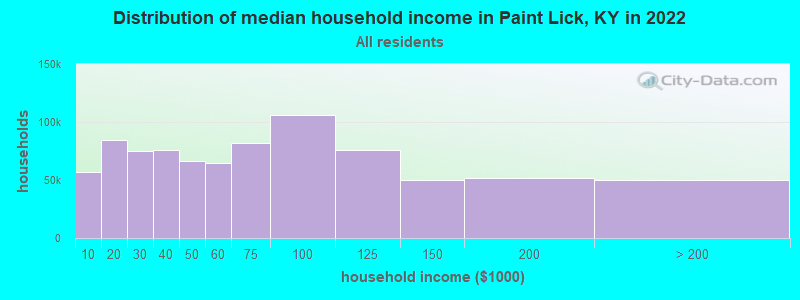
Paint Lick, KY household income distribution

- 49,240Less than $10,000
- 79,887$10,000 to $19,999
- 67,317$20,000 to $29,999
- 71,320$30,000 to $39,999
- 54,501$40,000 to $49,999
- 59,878$50,000 to $59,999
- 68,693$60,000 to $74,999
- 95,199$75,000 to $99,999
- 68,030$100,000 to $124,999
- 41,742$125,000 to $149,999
- 41,371$150,000 to $199,999
- 35,565$200,000 or more
Percentage of workers working in this county: 20.8%
Number of people working at home: 106 (8.5% of all workers)
Travel time to work (commute)
- Less than 5 minutes: 13
- 5 to 9 minutes: 46
- 10 to 14 minutes: 110
- 15 to 19 minutes: 176
- 20 to 24 minutes: 157
- 25 to 29 minutes: 99
- 30 to 34 minutes: 192
- 35 to 39 minutes: 50
- 40 to 44 minutes: 83
- 45 to 59 minutes: 133
- 60 to 89 minutes: 96
- 90 or more minutes: 16
Means of transportation to work:
- Drove a car alone: 930 (77.7%)
- Carpooled: 220 (18.4%)
- Bus or trolley bus: 5 (0.4%)
- Walked: 16 (1.3%)
- Worked at home: 26 (2.2%)


- Year of entry for the foreign-born population in Paint Lick, Kentucky
- 91995 to March 2000
- 91990 to 1994
- 61985 to 1989
- 01980 to 1984
- 01975 to 1979
- 01970 to 1974
- 71965 to 1969
- 0Before 1965
Most common places of birth for foreign-born residents (%):
| Paint Lick: | 29.0% (9) |
| Kentucky: | 19.3% (15,511) |
| Paint Lick: | 29.0% (9) |
| Kentucky: | 0.1% (92) |
| Paint Lick: | 22.6% (7) |
| Kentucky: | 8.3% (6,658) |
| Paint Lick: | 19.4% (6) |
| Kentucky: | 0.3% (225) |
Place of birth for U.S.-born residents:
- This state: 2,267
- Other state: 447
- Northeast: 142
- Midwest: 202
- South: 103
- West: 0
55% of Paint Lick residents lived in the same house 5 years ago.
Out of people who lived in different houses, 37% lived in this county.
Out of people who lived in different counties, 82% lived in Kentucky.
Education attainment for males 25 years and older:
- No schooling: 17
- Nursery to 4th grade: 11
- 5th and 6th grade: 37
- 7th and 8th grade: 139
- 9th grade: 50
- 10th grade: 82
- 11th grade: 50
- 12th grade, no diploma: 5
- High school graduate (or equivalency): 311
- Less than 1 year of college: 45
- Some college more than 1 year, no degree: 82
- Associate degree: 16
- Bachelor's degree: 76
- Master's degree: 0
- Professional school degree: 13
- Doctorate degree: 0

Education attainment for females 25 years and older:
- No schooling: 6
- Nursery to 4th grade: 12
- 5th and 6th grade: 14
- 7th and 8th grade: 52
- 9th grade: 28
- 10th grade: 40
- 11th grade: 30
- 12th grade, no diploma: 31
- High school graduate (or equivalency): 372
- Less than 1 year of college: 42
- Some college more than 1 year, no degree: 99
- Associate degree: 70
- Bachelor's degree: 63
- Master's degree: 29
- Professional school degree: 6
- Doctorate degree: 8


Housing units in structures:
- One, detached: 830
- One, attached: 8
- 3 or 4: 8
- Mobile homes: 346
- Boats, RVs, vans, etc.: 15
Median worth of mobile homes: $82,958
Housing units lacking complete kitchen facilities: 2.2%

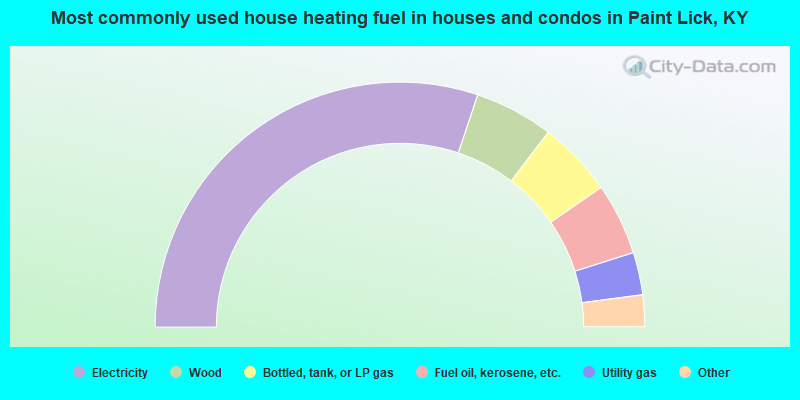
- 60.3%Electricity
- 10.4%Wood
- 10.0%Bottled, tank, or LP gas
- 9.5%Fuel oil, kerosene, etc.
- 5.6%Utility gas
- 2.7%Coal or coke
- 1.4%Other fuel
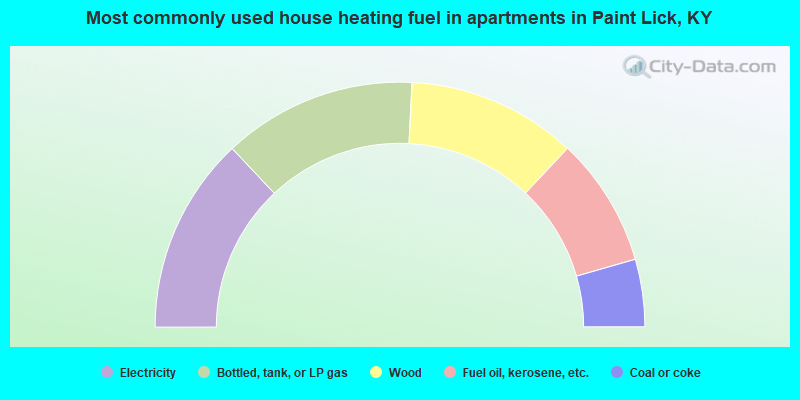
- 26.0%Electricity
- 25.6%Bottled, tank, or LP gas
- 22.4%Wood
- 17.1%Fuel oil, kerosene, etc.
- 8.9%Coal or coke
Private vs. public school enrollment:
| Here: | 10.0% |
| Kentucky: | 11.9% |
| Here: | 16.3% |
| Kentucky: | 10.6% |
| Here: | 20.6% |
| Kentucky: | 18.1% |


