South Rosemary, NC (North Carolina) Houses and Residents
| South Rosemary: | $100,342 |
| North Carolina: | $280,600 |
Mean price in 2022:
Detached houses: $130,332
Here: $130,332 State: $375,326 Mobile homes: $96,132
Here: $96,132 State: $124,933
Total population: 2,836 (Urban population: 1,211 (all inside urban clusters), Rural population: 1,636 (32 farm, 1,604 nonfarm))
Houses: 1,395 (1,207 occupied: 870 owner occupied, 355 renter occupied)
| % of renters here: | 29% |
| State: | 33% |
Housing density: 227 houses/condos per square mile
Median price asked for vacant for-sale houses and condos in 2022 in this county: $123,085.
Median contract rent in 2022: $607 (lower quartile is $537, upper quartile is $750)
Median rent asked for vacant for-rent units in 2022: $785
Median gross rent in South Rosemary, NC in 2022: $898
Housing units in South Rosemary with a mortgage: 445 (17 second mortgage, 0 home equity loan, 17 both second mortgage and home equity loan)
Houses without a mortgage: 0
Median household income for houses/condos with a mortgage: $46,023
Median household income for apartments without a mortgage: $55,828
Median monthly housing costs: $819
Compare current foreclosures near South Rosemary, NC:
| Photo | Address | Area | Beds / Baths | Price | Details |
|---|---|---|---|---|---|

|
#1
Brink Rd
Emporia, VA 23847
|
1,548 sq. feet
|
2 baths 3 beds |
show details | |

|
#2
River Rd
Henrico, NC 27842
|
1,654 sq. feet
|
2 baths 4 beds |
show details | |

|
#3
James Edward Dr
Roanoke Rapids, NC 27870
|
1,188 sq. feet
|
1 baths 3 beds |
show details | |

|
#4
Moores Ferry Rd
Skippers, VA 23879
|
1,608 sq. feet
|
1 baths 4 beds |
show details | |

|
#5
Pine Log Rd
Skippers, VA 23879
|
2,145 sq. feet
|
2 baths 4 beds |
show details | |

|
#6
Caney Branch Rd
Emporia, VA 23847
|
1,008 sq. feet
|
1 baths 2 beds |
show details | |

|
#7
Moores Ferry Rd
Skippers, VA 23879
|
1,896 sq. feet
|
2 baths 4 beds |
show details | |

|
#8
Duke St
Jackson, NC 27845
|
800 sq. feet
|
- baths 2 beds |
show details | |

|
#9
Cherry Tree Rd
Gaston, NC 27832
|
1,075 sq. feet
|
- baths 3 beds |
show details | |

|
#10
Hedgepeth Rd
Enfield, NC 27823
|
1,134 sq. feet
|
2 baths - beds |
show details |
| Photo | Address | Area | Beds / Baths | Price | Details |
|---|---|---|---|---|---|

|
#11
Telia Trl
Gaston, NC 27832
|
1,716 sq. feet
|
- baths 3 beds |
show details | |

|
#12
Virginia St
Roanoke Rapids, NC 27870
|
1,370 sq. feet
|
2 baths - beds |
show details | |

|
#13
Dominion Ct
Roanoke Rapids, NC 27870
|
1,088 sq. feet
|
1 baths - beds |
show details | |

|
#14
Vance St
Roanoke Rapids, NC 27870
|
1,102 sq. feet
|
1 baths - beds |
show details | |

|
#15
Virginia St
Roanoke Rapids, NC 27870
|
1,268 sq. feet
|
1 baths - beds |
show details | |

|
#16
Grant Dr
Roanoke Rapids, NC 27870
|
1,120 sq. feet
|
2 baths - beds |
show details | |

|
#17
Washington St
Roanoke Rapids, NC 27870
|
1,408 sq. feet
|
2 baths - beds |
show details | |

|
#18
Jane Ln
Pleasant Hill, NC 27866
|
2,052 sq. feet
|
- baths 4 beds |
show details | |

|
#19
James Jones Rd
Pleasant Hill, NC 27866
|
2,052 sq. feet
|
- baths 4 beds |
show details | |

|
#20
Cal Floyd Rd
Garysburg, NC 27831
|
1,960 sq. feet
|
- baths 3 beds |
show details |
| Photo | Address | Area | Beds / Baths | Price | Details |
|---|---|---|---|---|---|

|
#21
Martin Cir
Roanoke Rapids, NC 27870
|
1,134 sq. feet
|
1 baths - beds |
show details | |

|
#22
E 11th St
Weldon, NC 27890
|
942 sq. feet
|
1 baths - beds |
show details | |

|
#23
Davie Smith St
Roanoke Rapids, NC 27870
|
1,182 sq. feet
|
2 baths - beds |
show details | |

|
#24
Will Richardson Rd
Enfield, NC 27823
|
1,130 sq. feet
|
2 baths - beds |
show details | |

|
#25
Ringwood Rd
Enfield, NC 27823
|
1,430 sq. feet
|
1 baths - beds |
show details | |

|
#26
Medoc Mountain Rd
Enfield, NC 27823
|
1,152 sq. feet
|
2 baths - beds |
show details | |

|
#27
Us Highway 301
Pleasant Hill, NC 27866
|
1,330 sq. feet
|
- baths 3 beds |
show details | |

|
#28
Medoc Mountain Rd
Enfield, NC 27823
|
1,803 sq. feet
|
1 baths - beds |
show details | |

|
#29
Community Ln
Gaston, NC 27832
|
2,280 sq. feet
|
- baths 4 beds |
show details | |

|
#30
Gregory Farm Rd
Halifax, NC 27839
|
1,325 sq. feet
|
1 baths - beds |
show details |
| Photo | Address | Area | Beds / Baths | Price | Details |
|---|---|---|---|---|---|

|
#31
Arcadia Rd
Henrico, NC 27842
|
1,568 sq. feet
|
- baths 2 beds |
show details | |

|
#32
Waterside Dr
Henrico, NC 27842
|
2,656 sq. feet
|
- baths 4 beds |
show details | |

|
#33
Hickory Tree Rd
Pleasant Hill, NC 27866
|
1,064 sq. feet
|
- baths 3 beds |
show details | |

|
#34
E 12th St
Roanoke Rapids, NC 27870
|
1,052 sq. feet
|
1 baths - beds |
show details | |

|
#35
Monroe St
Roanoke Rapids, NC 27870
|
1,060 sq. feet
|
1 baths - beds |
show details | |

|
#36
Sam Powell Dairy Rd
Roanoke Rapids, NC 27870
|
1,546 sq. feet
|
2 baths - beds |
show details | |

|
#37
Forest Hill Dr
Littleton, NC 27850
|
- sq. feet
|
2 baths 3 beds |
show details | |

|
#38
Reynolds Cir
Roanoke Rapids, NC 27870
|
1,040 sq. feet
|
2 baths - beds |
show details | |

|
#39
Haven Dr
Roanoke Rapids, NC 27870
|
2,324 sq. feet
|
2 baths - beds |
show details | |

|
#40
Johnston St
Roanoke Rapids, NC 27870
|
1,722 sq. feet
|
2 baths - beds |
show details |
| Photo | Address | Area | Beds / Baths | Price | Details |
|---|---|---|---|---|---|

|
#41
Oakland St
Roanoke Rapids, NC 27870
|
1,204 sq. feet
|
1 baths - beds |
show details | |

|
#42
Nc Highway 4
Littleton, NC 27850
|
1,440 sq. feet
|
2 baths - beds |
show details | |

|
#43
Fairlane Dr
Roanoke Rapids, NC 27870
|
1,860 sq. feet
|
2 baths - beds |
show details | |

|
#44
Nc Highway 4
Littleton, NC 27850
|
960 sq. feet
|
1 baths - beds |
show details | |

|
#45
Hales Branch Dr
Roanoke Rapids, NC 27870
|
1,512 sq. feet
|
2 baths - beds |
show details | |

|
#46
Us Highway 158
Roanoke Rapids, NC 27870
|
960 sq. feet
|
1 baths - beds |
show details | |

|
#47
Canterbury Ct
Roanoke Rapids, NC 27870
|
1,403 sq. feet
|
2 baths - beds |
show details | |

|
#48
Farley Cir
Roanoke Rapids, NC 27870
|
1,152 sq. feet
|
1 baths - beds |
show details | |

|
#49
Matthews St
Roanoke Rapids, NC 27870
|
1,323 sq. feet
|
2 baths - beds |
show details | |

|
Check over 1 million property listings on Foreclosure.com!
|
browse all offers | |||


Median year apartment built: 1961
Household type by relationship:
Households: 2,939- Male householders: 444 (67 living alone), Female householders: 751 (152 living alone)
445 spouses (445 opposite-sex spouses), 106 unmarried partners, (106 opposite-sex unmarried partners), 811 children (778 natural, 19 adopted, 13 stepchildren), 135 grandchildren, 36 brothers or sisters, 54 parents, 26 foster children, 108 other relatives, 19 non-relatives
Size of family households: 509 2-persons, 334 3-persons, 128 4-persons.
Size of nonfamily households: 223 1-person, 32 2-persons.
68 married couples with children.
398 single-parent households (26 men, 372 women).
99.7% of residents of South Rosemary speak English at home.
| Here: | 6.1 |
| State: | 6.4 |
| Here: | 5.2 |
| State: | 4.4 |

- Bedrooms in owner-occupied houses and condos in South Rosemary, North Carolina
- 0no bedroom
- 01 bedroom
- 1692 bedrooms
- 5143 bedrooms
- 1874 bedrooms
- 05+ bedrooms

- Bedrooms in renter-occupied apartments in South Rosemary, North Carolina
- 0no bedroom
- 01 bedroom
- 822 bedrooms
- 2733 bedrooms
- 04 bedrooms
- 05+ bedrooms

- Cars and other vehicles available in South Rosemary in owner-occupied houses/condos
- 39no vehicle
- 1671 vehicle
- 3222 vehicles
- 1773 vehicles
- 1274 vehicles
- 405+ vehicles

- Cars and other vehicles available in South Rosemary in renter-occupied apartments
- 45no vehicle
- 1581 vehicle
- 1392 vehicles
- 03 vehicles
- 134 vehicles
- 05+ vehicles

- Rooms in owner-occupied houses in South Rosemary, North Carolina
- 01 room
- 02 rooms
- 03 rooms
- 584 rooms
- 1815 rooms
- 3456 rooms
- 1997 rooms
- 508 rooms
- 389+ rooms

- Rooms in renter-occupied apartments in South Rosemary, North Carolina
- 01 room
- 02 rooms
- 03 rooms
- 574 rooms
- 1625 rooms
- 1276 rooms
- 07 rooms
- 08 rooms
- 99+ rooms


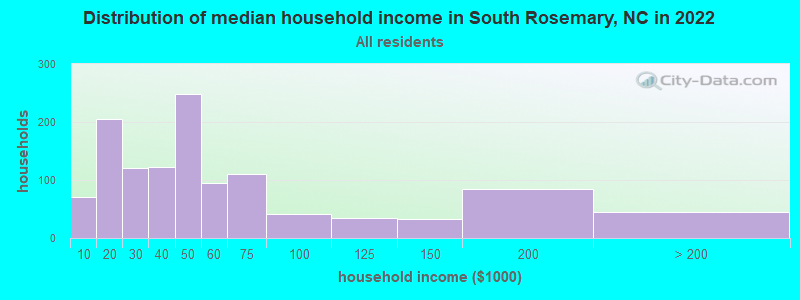
South Rosemary, NC household income distribution

- 70Less than $10,000
- 205$10,000 to $19,999
- 120$20,000 to $29,999
- 122$30,000 to $39,999
- 248$40,000 to $49,999
- 94$50,000 to $59,999
- 110$60,000 to $74,999
- 42$75,000 to $99,999
- 34$100,000 to $124,999
- 33$125,000 to $149,999
- 84$150,000 to $199,999
- 44$200,000 or more
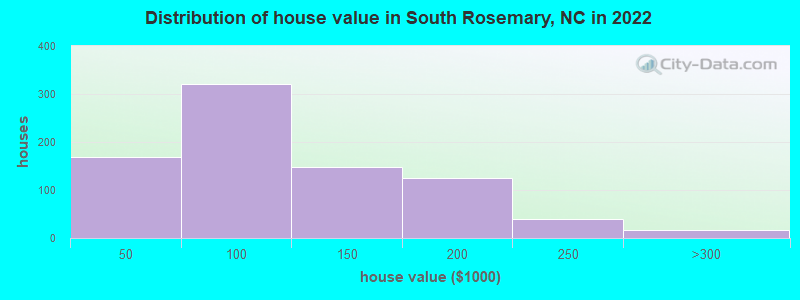
Home value of owner - occupied houses in 2022 in South Rosemary, NC
-
- 15Less than $10,000
- 34$10,000 to $14,999
- 38$20,000 to $24,999
- 21$25,000 to $29,999
- 8$35,000 to $39,999
- 51$40,000 to $49,999
- 29$50,000 to $59,999
- 101$60,000 to $69,999
- 89$70,000 to $79,999
- 44$80,000 to $89,999
- 5$90,000 to $99,999
- 141$100,000 to $124,999
- 4$125,000 to $149,999
- 101$150,000 to $174,999
- 23$175,000 to $199,999
- 40$200,000 to $249,999
- 16$250,000 to $299,999
Rent paid by renters in 2022 in South Rosemary, NC
-
- 44$200 to $249
- 11$300 to $349
- 107$500 to $549
- 31$550 to $599
- 25$600 to $649
- 49$650 to $699
- 36$700 to $749
- 32$800 to $899


Percentage of workers working in this county: 75.2%
Number of people working at home: 270 (21.8% of all workers)
Travel time to work (commute)
- Less than 5 minutes: 132
- 5 to 9 minutes: 59
- 10 to 14 minutes: 185
- 15 to 19 minutes: 162
- 20 to 24 minutes: 80
- 25 to 29 minutes: 118
- 30 to 34 minutes: 77
- 35 to 39 minutes: 41
- 40 to 44 minutes: 0
- 45 to 59 minutes: 69
- 60 to 89 minutes: 57
- 90 or more minutes: 7
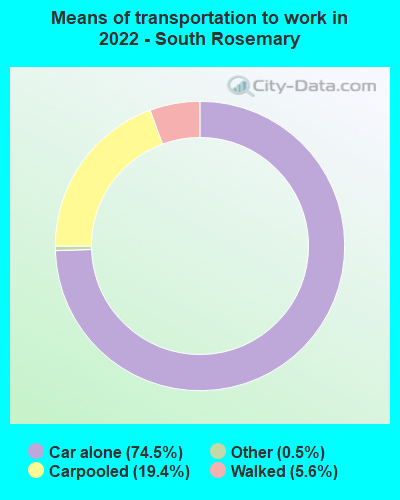
Means of transportation to work:
- Drove a car alone: 481 (54.5%)
- Carpooled: 130 (14.7%)
- Taxi: 3 (0.3%)
- Walked: 39 (4.4%)
- Worked at home: 270 (30.6%)

- Unemployment by race in 2022
- Unemployment rate for Black residents
- 6.4%Females

- Year of entry for the foreign-born population in South Rosemary, North Carolina
- 291995 to March 2000
- 01990 to 1994
- 01985 to 1989
- 81980 to 1984
- 01975 to 1979
- 01970 to 1974
- 01965 to 1969
- 0Before 1965

First ancestries reported:
- English: 135 (6.4%)
- American: 128 (6.1%)
- Portuguese: 48 (2.3%)
- Scotch-Irish: 41 (2.0%)
- Italian: 24 (1.1%)
- Irish: 11 (0.5%)
- British: 9 (0.4%)
Most common places of birth for foreign-born residents (%):
| South Rosemary: | 35.1% (13) |
| North Carolina: | 0.5% (2,044) |
| South Rosemary: | 21.6% (8) |
| North Carolina: | 3.8% (16,166) |
| South Rosemary: | 21.6% (8) |
| North Carolina: | 0.9% (3,979) |
| South Rosemary: | 21.6% (8) |
| North Carolina: | 0.7% (3,123) |
Place of birth for U.S.-born residents:
- This state: 2,317
- Other state: 582
- Northeast: 251
- Midwest: 10
- South: 319
- West: 0
87.6% of South Rosemary residents lived in the same house 1 years ago.
Out of people who lived in different houses, 28.6% lived in this county.
Out of people who lived in different counties, 100.0% lived in North Carolina.
| South Rosemary: | 87.6% |
| State average: | 87.3% |
Education attainment for males 25 years and older:
- No schooling: 20
- Nursery to 4th grade: 18
- 5th and 6th grade: 0
- 7th and 8th grade: 74
- 9th grade: 5
- 10th grade: 27
- 11th grade: 33
- 12th grade, no diploma: 0
- High school graduate (or equivalency): 477
- Less than 1 year of college: 82
- Some college more than 1 year, no degree: 64
- Associate degree: 31
- Bachelor's degree: 217
- Master's degree: 0
- Professional school degree: 0
- Doctorate degree: 0

Education attainment for females 25 years and older:
- No schooling: 53
- Nursery to 4th grade: 0
- 5th and 6th grade: 8
- 7th and 8th grade: 89
- 9th grade: 0
- 10th grade: 28
- 11th grade: 29
- 12th grade, no diploma: 25
- High school graduate (or equivalency): 420
- Less than 1 year of college: 87
- Some college more than 1 year, no degree: 241
- Associate degree: 54
- Bachelor's degree: 95
- Master's degree: 7
- Professional school degree: 0
- Doctorate degree: 18


Housing units in structures:
- One, detached: 734
- One, attached: 25
- Mobile homes: 634
Median worth of mobile homes: $89,352
Housing units lacking complete kitchen facilities in 2022: 3.1%
House/condo owner moved in on average 22 years ago
Renter moved in on average 4 years ago

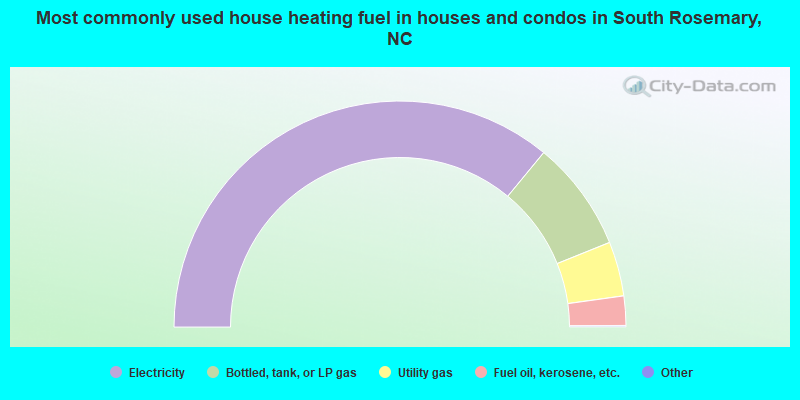
- 72.1%Electricity
- 15.9%Bottled, tank, or LP gas
- 7.8%Utility gas
- 4.2%Fuel oil, kerosene, etc.
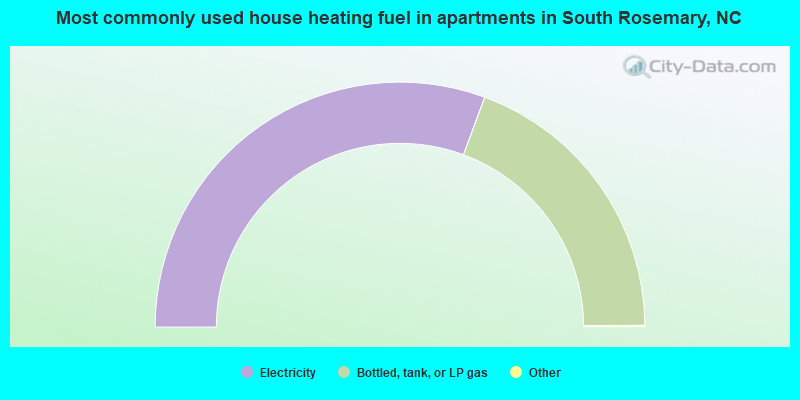
- 61.4%Electricity
- 38.6%Bottled, tank, or LP gas
Private vs. public school enrollment:
| Here: | 9.0% |
| North Carolina: | 13.8% |
| Here: | 26.7% |
| North Carolina: | 11.9% |
| Here: | 0.0% |
| North Carolina: | 19.3% |


