Races in Shields Valley, Montana (MT) Detailed Stats
Ancestries, Foreign-born residents, place of birth
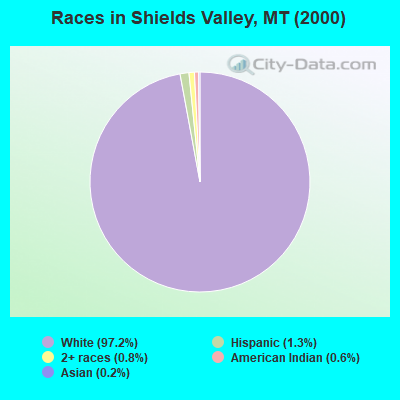
Race distribution in Shields Valley

- 1,83397.2%White alone
- 241.3%Hispanic
- 150.8%Two or more races
- 110.6%American Indian alone
- 30.2%Asian alone
2000
2022
-
- 807,82389.5%White alone
- 54,4266.0%American Indian alone
- 18,0812.0%Hispanic
- 13,7681.5%Two or more races
- 4,5690.5%Asian alone
- 2,5340.3%Black alone
- 5690.06%Other race alone
- 4250.05%Native Hawaiian and Other
Pacific Islander alone

-
- 937,36583.5%White alone
- 58,7485.2%American Indian alone
- 55,1724.9%Two or more races
- 49,8304.4%Hispanic
- 9,0120.8%Other race alone
- 7,7000.7%Asian alone
- 3,4280.3%Black alone
- 1,6120.1%Native Hawaiian and Other
Pacific Islander alone

Income and house value in Shields Valley
- Median household income in 2022
- $68,321White non-Hispanic householders
- $86,075American Indian and Alaska Native householders
- $19,032Two or more races householders
- $32,787Hispanic or Latino race householders
- Median 2022 house value
- $439,684White Non-Hispanic householders
- $905,943American Indian or Alaska Native householders
Household income for White non-Hispanic householders

Household income for American Indian and Alaska Native householders

Household income for Two or more races householders

Household income for Hispanic or Latino race householders

Zip code: 59086