Estimated zip code population in 2022: 2,247 Zip code population in 2010: 2,331 Zip code population in 2000: 2,570
Houses and condos: 945 Renter-occupied apartments: 168
% of renters here:
18%
State:
31%
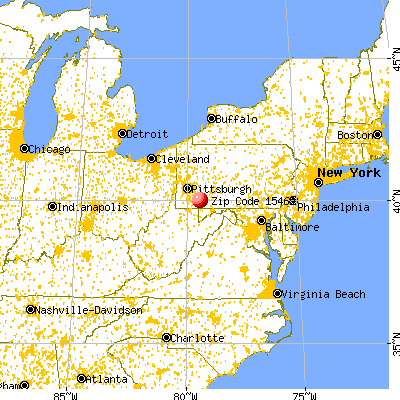
March 2022 cost of living index in zip code 15469: 88.5 (less than average, U.S. average is 100)
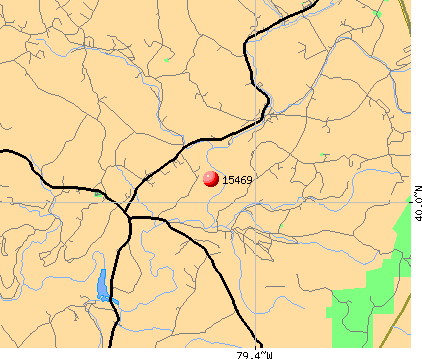
Land area: 34.0 sq. mi. Water area: 0.1 sq. mi.
Population density: 66 people per square mile
(very low).
OSM Map
General Map
Google Map
MSN Map
OSM Map
General Map
Google Map
MSN Map
OSM Map
General Map
Google Map
MSN Map
OSM Map
General Map
Google Map
MSN Map
Please wait while loading the map...
Real estate property taxes paid for housing units in 2022:
This zip code:
1.2% ($1,549)
Pennsylvania:
1.3% ($3,094)
Median real estate property taxes paid for housing units with mortgages in 2022: $2,261 (1.3%) Median real estate property taxes paid for housing units with no mortgage in 2022: $1,235 (1.1%)
Business Search- 14 Million verified businesses
Males: 1,120
(49.8%)
Females: 1,126
(50.2%)
For population 25 years and over in 15469:
High school or higher: 80.8%
Bachelor's degree or higher: 9.9%
Graduate or professional degree: 4.7%
Unemployed: 10.9%
Mean travel time to work (commute): 36.5 minutes
For population 15 years and over in 15469:
Never married: 24.5%
Now married: 58.5%
Separated: 2.2%
Widowed: 9.6%
Divorced: 5.3%
Zip code 15469 compared to state average:
Median household income below state average.
Median house value below state average.
Unemployed percentage above state average.
Black race population percentage significantly below state average.
Hispanic race population percentage significantly below state average.
Median age significantly above state average.
Foreign-born population percentage significantly below state average.
Renting percentage below state average.
Length of stay since moving in significantly above state average.
Number of college students significantly below state average.
Percentage of population with a bachelor's degree or higher significantly below state average.
Estimated median house/condo value in 2022: $131,433
15469:
$131,433
Pennsylvania:
$245,500
According to our research of Pennsylvania and other state lists, there were 2 registered sex offenders living in 15469 zip code as of June 16, 2024. The ratio of all residents to sex offenders in zip code 15469 is 1,092 to 1. The ratio of registered sex offenders to all residents in this zip code is lower than the state average.
Median resident age:
This zip code:
54.5 years
Pennsylvania median age:
40.9 years
Average household size:
This zip code:
2.3 people
Pennsylvania:
2.4 people
Averages for the 2020 tax year for zip code 15469, filed in 2021:
Average Adjusted Gross Income (AGI) in 2020: $47,305 (Individual Income Tax Returns)
Here:
$47,305
State:
$75,707
Salary/wage: $42,566 (reported on 80.6% of returns)
Here:
$42,566
State:
$62,806
(% of AGI for various income ranges: 1078.0% for AGIs below $25k, 3035.0% for AGIs $25k-50k, 6249.1% for AGIs $50k-75k, 7865.7% for AGIs $75k-100k, 14843.8% for AGIs $100k-200k)
Taxable interest for individuals: $429 (reported on 21.4% of returns)
This zip code:
$429
Pennsylvania:
$1,633
(% of AGI for various income ranges: 5.2% for AGIs below $25k, 5.9% for AGIs $25k-50k, 30.9% for AGIs $50k-75k, 24.3% for AGIs $75k-100k, 16.2% for AGIs $100k-200k)
Ordinary dividends: $745 (reported on 11.2% of returns)
Here:
$745
State:
$7,382
(% of AGI for various income ranges: 4.0% for AGIs below $25k, 5.9% for AGIs $25k-50k, 19.1% for AGIs $50k-75k, 47.5% for AGIs $100k-200k)
Net capital gain/loss in AGI: +$2,350 (reported on 8.2% of returns)
Here:
+$2,350
State:
+$23,522
(% of AGI for various income ranges: 36.4% for AGIs $25k-50k, 154.3% for AGIs $75k-100k)
Profit/loss from business: +$10,631 (reported on 13.3% of returns)
Here:
+$10,631
State:
+$16,274
(% of AGI for various income ranges: 156.8% for AGIs below $25k, 114.1% for AGIs $25k-50k, 265.5% for AGIs $50k-75k, 638.6% for AGIs $75k-100k)
Taxable individual retirement arrangement distribution: $9,200 (reported on 9.2% of returns)
15469:
$9,200
Pennsylvania:
$18,583
(% of AGI for various income ranges: 76.0% for AGIs below $25k, 130.9% for AGIs $25k-50k, 318.2% for AGIs $50k-75k)
Earned income credit: $2,147 (reported on 17.3% of returns)
Here:
$2,147
State:
$2,100
(% of AGI for various income ranges: 90.4% for AGIs below $25k, 63.2% for AGIs $25k-50k)
Percentage of individuals using paid preparers for their 2020 taxes: 95.9%
Here:
96%
State:
92%
(% for various income ranges: 94.6% for AGIs below $25k, 96.3% for AGIs $25k-50k, 93.3% for AGIs $50k-75k, 100.0% for AGIs $75k-100k, 100.0% for AGIs $100k-200k)
Averages for the 2012 tax year for zip code 15469, filed in 2013:
Average Adjusted Gross Income (AGI) in 2012: $38,073 (Individual Income Tax Returns)
Here:
$38,073
State:
$61,346
Salary/wage: $35,196 (reported on 86.2% of returns)
Here:
$35,196
State:
$51,902
(% of AGI for various income ranges: 73.0% for AGIs below $25k, 77.7% for AGIs $25k-50k, 83.2% for AGIs $50k-75k, 83.3% for AGIs $75k-100k, 78.7% for AGIs $100k-200k)
Taxable interest for individuals: $371 (reported on 22.3% of returns)
This zip code:
$371
Pennsylvania:
$1,588
(% of AGI for various income ranges: 0.4% for AGIs below $25k, 0.3% for AGIs $25k-50k, 0.3% for AGIs $75k-100k)
Ordinary dividends: $500 (reported on 11.7% of returns)
Here:
$500
State:
$5,827
(% of AGI for various income ranges: 0.2% for AGIs below $25k, 0.2% for AGIs $25k-50k, 0.4% for AGIs $75k-100k)
Net capital gain/loss in AGI: +$1,280 (reported on 5.3% of returns)
Here:
+$1,280
State:
+$14,495
Profit/loss from business: +$6,331 (reported on 13.8% of returns)
Here:
+$6,331
State:
+$16,268
(% of AGI for various income ranges: 7.1% for AGIs below $25k, 2.2% for AGIs $25k-50k, 3.0% for AGIs $50k-75k)
Taxable individual retirement arrangement distribution: $8,100 (reported on 8.5% of returns)
15469:
$8,100
Pennsylvania:
$14,550
(% of AGI for various income ranges: 3.4% for AGIs below $25k, 2.0% for AGIs $25k-50k, 3.3% for AGIs $50k-75k)
Total itemized deductions: $19,000 (24% of AGI, reported on 14.9% of returns)
Here:
$19,000
State:
$23,538
Here:
23.9% of AGI
State:
18.4% of AGI
(% of AGI for various income ranges: 5.3% for AGIs $25k-50k, 7.3% for AGIs $50k-75k, 10.3% for AGIs $75k-100k, 13.3% for AGIs $100k-200k)
Charity contributions: $2,611 (reported on 9.6% of returns)
Here:
$2,611
State:
$4,025
(% of AGI for various income ranges: 1.3% for AGIs $50k-75k, 0.8% for AGIs $75k-100k, 1.0% for AGIs $100k-200k)
Taxes paid: $4,879 (reported on 14.9% of returns)
15469:
$4,879
State:
$9,982
(% of AGI for various income ranges: 1.2% for AGIs $25k-50k, 1.6% for AGIs $50k-75k, 2.6% for AGIs $75k-100k, 4.0% for AGIs $100k-200k)
Earned income credit: $2,415 (reported on 21.3% of returns)
Here:
$2,415
State:
$2,106
(% of AGI for various income ranges: 7.5% for AGIs below $25k, 1.2% for AGIs $25k-50k)
Percentage of individuals using paid preparers for their 2012 taxes: 69.1%
Here:
69%
State:
53%
(% for various income ranges: 62.8% for AGIs below $25k, 69.6% for AGIs $25k-50k, 80.0% for AGIs $50k-75k, 75.0% for AGIs $75k-100k, 80.0% for AGIs $100k-200k)
Averages for the 2004 tax year for zip code 15469, filed in 2005:
Average Adjusted Gross Income (AGI) in 2004: $27,621 (Individual Income Tax Returns)
Here:
$27,621
State:
$48,049
Salary/wage: $26,167 (reported on 86.8% of returns)
Here:
$26,167
State:
$42,646
(% of AGI for various income ranges: 116.2% for AGIs below $10k, 80.1% for AGIs $10k-25k, 83.9% for AGIs $25k-50k, 85.1% for AGIs $50k-75k, 127.7% for AGIs $75k-100k)
Taxable interest for individuals: $545 (reported on 29.3% of returns)
This zip code:
$545
Pennsylvania:
$1,657
(% of AGI for various income ranges: 2.8% for AGIs below $10k, 1.2% for AGIs $10k-25k, 0.5% for AGIs $25k-50k, 0.2% for AGIs $50k-75k, 0.2% for AGIs $75k-100k)
Taxable dividends: $276 (reported on 11.2% of returns)
Here:
$276
State:
$3,566
(% of AGI for various income ranges: 0.4% for AGIs below $10k, 0.3% for AGIs $10k-25k, 0.1% for AGIs $25k-50k, 0.0% for AGIs $50k-75k, 0.3% for AGIs $75k-100k)
Net capital gain/loss: +$411 (reported on 6.0% of returns)
Here:
+$411
State:
+$9,716
Profit/loss from business: +$8,030 (reported on 14.4% of returns)
Here:
+$8,030
State:
+$14,267
(% of AGI for various income ranges: 23.2% for AGIs below $10k, 4.9% for AGIs $10k-25k, 2.4% for AGIs $25k-50k, 6.5% for AGIs $50k-75k)
IRA payment deduction: $1,963 (reported on 2.9% of returns)
15469:
$1,963
Pennsylvania:
$2,903
Total itemized deductions: $13,900 (24% of AGI, reported on 11.7% of returns)
Here:
$13,900
State:
$18,804
Here:
24.4% of AGI
State:
19.5% of AGI
(% of AGI for various income ranges: 16.8% for AGIs below $10k, 4.7% for AGIs $25k-50k, 8.1% for AGIs $50k-75k, 19.4% for AGIs $75k-100k)
Charity contributions deductions: $2,111 (3% of AGI, reported on 8.6% of returns)
Here:
$2,111
State:
$3,337
Here:
3.4% of AGI
State:
3.3% of AGI
Total tax: $3,133 (reported on 66.5% of returns)
15469:
$3,133
State:
$8,008
(% of AGI for various income ranges: 5.4% for AGIs below $10k, 3.5% for AGIs $10k-25k, 6.3% for AGIs $25k-50k, 8.9% for AGIs $50k-75k, 10.1% for AGIs $75k-100k, 18.0% for AGIs over 100k)
Earned income credit: $1,825 (reported on 24.4% of returns)
Here:
$1,825
State:
$1,643
Percentage of individuals using paid preparers for their 2004 taxes: 68.9%
Here:
69%
State:
56%
(% for various income ranges: 63.5% for AGIs below $10k, 70.1% for AGIs $10k-25k, 68.8% for AGIs $25k-50k, 74.1% for AGIs $50k-75k, 70.8% for AGIs $75k-100k, 92.3% for AGIs over 100k)
Notable locations in zip code 15469: Camp Wildwood (A), Salt Lick (B), White Bridge (C), Normalville Area Volunteer Fire Department Station 51 (D). Display/hide their locations on the map
Churches in zip code 15469 include: Rogers Mill Church (A), Mount Zion Church (B), Hillview Church (C), Poplar Run Church (D), House of Prayer (E). Display/hide their locations on the map
Streams, rivers, and creeks: South Spruce Run (A), Newmyer Run (B), Mill Run (C), Laurel Run (D), Buck Run (E), Rasler Run (F), Poplar Run (G). Display/hide their locations on the map
In group quarters: 62 (-1 institutionalized population)
Size of family households: 395 2-persons, 122 3-persons, 109 4-persons, 65 5-persons
Size of nonfamily households: 247 1-person, 9 2-persons
224 married couples with children.
148 single-parent households (70 men, 78 women).
99.2% of residents of 15469 zip code speak English at home.
1.1% of residents speak other Indo-European language at home (100% very well).
Foreign born population: 16 (0.8%) (100.0% of them are naturalized citizens)
This zip code:
0.8%
Whole state:
7.5%
94%North Macedonia (Macedonia)
40%German
19%American
11%Polish
9%English
8%Irish
4%Italian
1%Dutch
Year of entry for the foreign-born population
02010 or later
02000 to 2009
01990 to 1999
22Before 1990
Public elementary/middle school in in zip code 15469 not listed on the city page:
SPRINGFIELD EL SCH(Students: 248, Location: 14 SCHOOL HOUSE ROAD, Grades: KG-6)
Facilities with environmental interests located in this zip code:
ASHLAND 762-000 (RT 381 & 711 in NORMALVILLE, PA)
Small Quantity Generators, between 100 kg and 1000 kg of hazardous waste/month (Resource Conservation and Recovery Act (tracking hazardous waste)) - notification Organizations: ASHLAND BRANDED MKTG (CONTACT/OWNER)
BIGAM SERVICE (INT RT 711 & 381 in NORMALVILLE, PA)
Small Quantity Generators, between 100 kg and 1000 kg of hazardous waste/month (Resource Conservation and Recovery Act (tracking hazardous waste)) - notification Organizations: RON BIGAM JR (CONTACT/OWNER)
Housing units lacking complete kitchen facilities: 1.0%
56.4%Fuel oil, kerosene, etc.
15.5%Electricity
11.9%Utility gas
7.6%Coal or coke
6.6%Wood
2.1%Bottled, tank, or LP gas
Population in 1990: 3,814.
Place of birth for U.S.-born residents:
This state: 2,152
South: 45
80% of the 15469 zip code residents lived in the same house 5 years ago. Out of people who lived in different houses, 81% lived in this county. Out of people who lived in different counties, 50% lived in Pennsylvania.
93% of the 15469 zip code residents lived in the same house 1 year ago. Out of people who lived in different houses, 17% moved from this county. Out of people who lived in different houses, 47% moved from different county within same state. Out of people who lived in different houses, 42% moved from abroad.
Private vs. public school enrollment:
Students in private schools in grades 1 to 8 (elementary and middle school):
Here:
0.0%
Pennsylvania:
15.7%
Students in private schools in grades 9 to 12 (high school):
Here:
0.0%
Pennsylvania:
13.4%
Students in private undergraduate colleges:
Here:
0.0%
Pennsylvania:
39.8%
Occupation by median earnings in the past 12 months ($)
71,591Material moving occupations
38,183Food preparation and serving related occupations
23,356Office and administrative support occupations
Top industries in this zip code by the number of employees in 2005:
Health Care and Social Assistance: Other Individual and Family Services (10-19 employees: 1 establishment)
Other Services (except Public Administration): Civic and Social Organizations (10-19: 1)
Health Care and Social Assistance: Nursing Care Facilities (10-19: 1)
Real Estate and Rental and Leasing: Video Tape and Disc Rental (10-19: 1)
Wholesale Trade: Motor Vehicle Parts (Used) Merchant Wholesalers (5-9: 1)
Wholesale Trade: Wholesale Trade Agents and Brokers (5-9: 1)
People in group quarters in 2010:
34 people in group homes intended for adults
10 people in nursing facilities/skilled-nursing facilities
People in group quarters in 2000:
30 people in nursing homes
Home Mortgage Disclosure Act Aggregated Statistics For Year 2009 (Based on 2 partial tracts)
A) FHA, FSA/RHS & VA Home Purchase Loans
B) Conventional Home Purchase Loans
C) Refinancings
D) Home Improvement Loans
F) Non-occupant Loans on < 5 Family Dwellings (A B C & D)
G) Loans On Manufactured Home Dwelling (A B C & D)
Number
Average Value
Number
Average Value
Number
Average Value
Number
Average Value
Number
Average Value
Number
Average Value
LOANS ORIGINATED
5
$109,448
14
$177,361
67
$162,306
16
$33,425
25
$263,318
5
$32,044
APPLICATIONS APPROVED, NOT ACCEPTED
0
$0
4
$155,465
8
$144,674
0
$0
3
$242,647
1
$63,650
APPLICATIONS DENIED
1
$38,770
7
$55,810
42
$137,837
10
$35,702
11
$184,762
8
$33,745
APPLICATIONS WITHDRAWN
0
$0
1
$255,330
12
$187,777
1
$237,770
4
$324,465
1
$33,650
FILES CLOSED FOR INCOMPLETENESS
0
$0
1
$161,680
2
$140,835
1
$81,940
0
$0
0
$0
Aggregated Statistics For Year 2008 (Based on 2 partial tracts)
A) FHA, FSA/RHS & VA Home Purchase Loans
B) Conventional Home Purchase Loans
C) Refinancings
D) Home Improvement Loans
F) Non-occupant Loans on < 5 Family Dwellings (A B C & D)
G) Loans On Manufactured Home Dwelling (A B C & D)
Number
Average Value
Number
Average Value
Number
Average Value
Number
Average Value
Number
Average Value
Number
Average Value
LOANS ORIGINATED
4
$141,382
26
$187,824
37
$85,142
25
$28,971
16
$215,731
13
$63,818
APPLICATIONS APPROVED, NOT ACCEPTED
0
$0
4
$171,378
5
$86,622
4
$37,860
1
$305,080
1
$46,090
APPLICATIONS DENIED
0
$0
12
$193,082
51
$101,936
16
$17,696
4
$445,178
11
$65,578
APPLICATIONS WITHDRAWN
0
$0
4
$121,995
12
$104,923
1
$3,660
2
$182,170
1
$31,460
FILES CLOSED FOR INCOMPLETENESS
0
$0
0
$0
4
$73,525
1
$8,780
0
$0
0
$0
Aggregated Statistics For Year 2007 (Based on 2 partial tracts)
A) FHA, FSA/RHS & VA Home Purchase Loans
B) Conventional Home Purchase Loans
C) Refinancings
D) Home Improvement Loans
F) Non-occupant Loans on < 5 Family Dwellings (A B C & D)
G) Loans On Manufactured Home Dwelling (A B C & D)
Number
Average Value
Number
Average Value
Number
Average Value
Number
Average Value
Number
Average Value
Number
Average Value
LOANS ORIGINATED
5
$117,056
28
$159,489
59
$85,126
31
$44,628
20
$181,144
14
$46,091
APPLICATIONS APPROVED, NOT ACCEPTED
1
$123,640
4
$150,528
15
$76,135
5
$43,018
3
$163,147
4
$56,332
APPLICATIONS DENIED
1
$89,260
13
$157,407
78
$92,885
22
$29,297
4
$323,732
18
$50,196
APPLICATIONS WITHDRAWN
0
$0
5
$50,774
23
$98,830
1
$18,290
4
$61,820
1
$61,450
FILES CLOSED FOR INCOMPLETENESS
0
$0
0
$0
7
$217,494
0
$0
0
$0
0
$0
Aggregated Statistics For Year 2006 (Based on 2 partial tracts)
A) FHA, FSA/RHS & VA Home Purchase Loans
B) Conventional Home Purchase Loans
C) Refinancings
D) Home Improvement Loans
F) Non-occupant Loans on < 5 Family Dwellings (A B C & D)
G) Loans On Manufactured Home Dwelling (A B C & D)
Number
Average Value
Number
Average Value
Number
Average Value
Number
Average Value
Number
Average Value
Number
Average Value
LOANS ORIGINATED
4
$84,500
30
$150,832
64
$93,610
39
$39,094
17
$181,265
10
$58,235
APPLICATIONS APPROVED, NOT ACCEPTED
0
$0
11
$140,600
12
$94,864
8
$26,978
4
$237,038
4
$38,410
APPLICATIONS DENIED
2
$97,670
15
$57,894
94
$84,266
36
$24,834
1
$77,550
25
$55,221
APPLICATIONS WITHDRAWN
1
$62,190
5
$80,768
38
$104,330
1
$89,990
1
$143,390
3
$69,747
FILES CLOSED FOR INCOMPLETENESS
0
$0
0
$0
12
$155,770
0
$0
1
$40,240
1
$54,870
Aggregated Statistics For Year 2005 (Based on 2 partial tracts)
A) FHA, FSA/RHS & VA Home Purchase Loans
B) Conventional Home Purchase Loans
C) Refinancings
D) Home Improvement Loans
E) Loans on Dwellings For 5+ Families
F) Non-occupant Loans on < 5 Family Dwellings (A B C & D)
G) Loans On Manufactured Home Dwelling (A B C & D)
Number
Average Value
Number
Average Value
Number
Average Value
Number
Average Value
Number
Average Value
Number
Average Value
Number
Average Value
LOANS ORIGINATED
2
$65,110
28
$100,490
73
$96,180
37
$37,826
1
$367,260
9
$132,744
10
$47,408
APPLICATIONS APPROVED, NOT ACCEPTED
0
$0
12
$129,920
23
$66,226
4
$50,115
0
$0
1
$678,920
8
$63,100
APPLICATIONS DENIED
1
$79,740
29
$62,665
121
$94,902
31
$48,215
0
$0
7
$102,110
40
$58,949
APPLICATIONS WITHDRAWN
0
$0
3
$50,237
42
$103,556
7
$80,580
0
$0
0
$0
4
$79,745
FILES CLOSED FOR INCOMPLETENESS
0
$0
1
$64,380
10
$114,715
1
$22,680
0
$0
0
$0
0
$0
Aggregated Statistics For Year 2004 (Based on 2 partial tracts)
A) FHA, FSA/RHS & VA Home Purchase Loans
B) Conventional Home Purchase Loans
C) Refinancings
D) Home Improvement Loans
F) Non-occupant Loans on < 5 Family Dwellings (A B C & D)
G) Loans On Manufactured Home Dwelling (A B C & D)
Number
Average Value
Number
Average Value
Number
Average Value
Number
Average Value
Number
Average Value
Number
Average Value
LOANS ORIGINATED
4
$108,642
32
$141,610
101
$75,927
40
$36,598
20
$157,221
7
$64,171
APPLICATIONS APPROVED, NOT ACCEPTED
0
$0
3
$124,127
25
$68,712
4
$55,785
1
$128,030
4
$55,602
APPLICATIONS DENIED
0
$0
24
$70,051
118
$84,673
37
$33,436
4
$77,185
20
$42,689
APPLICATIONS WITHDRAWN
0
$0
4
$142,295
48
$86,725
6
$39,750
2
$174,485
5
$66,576
FILES CLOSED FOR INCOMPLETENESS
0
$0
1
$25,610
12
$118,032
1
$73,890
0
$0
1
$85,600
Aggregated Statistics For Year 2003 (Based on 2 partial tracts)
A) FHA, FSA/RHS & VA Home Purchase Loans
B) Conventional Home Purchase Loans
C) Refinancings
D) Home Improvement Loans
E) Loans on Dwellings For 5+ Families
F) Non-occupant Loans on < 5 Family Dwellings (A B C & D)
Number
Average Value
Number
Average Value
Number
Average Value
Number
Average Value
Number
Average Value
Number
Average Value
LOANS ORIGINATED
2
$132,785
57
$141,314
187
$83,524
45
$26,289
1
$267,030
58
$144,857
APPLICATIONS APPROVED, NOT ACCEPTED
1
$58,530
7
$59,991
53
$76,293
3
$32,923
0
$0
7
$167,327
APPLICATIONS DENIED
0
$0
18
$55,561
132
$70,483
39
$15,645
0
$0
8
$71,331
APPLICATIONS WITHDRAWN
0
$0
6
$100,230
64
$83,642
6
$31,458
0
$0
6
$96,327
FILES CLOSED FOR INCOMPLETENESS
1
$46,820
0
$0
7
$70,860
1
$27,800
0
$0
2
$103,885
Aggregated Statistics For Year 2002 (Based on 2 partial tracts)
A) FHA, FSA/RHS & VA Home Purchase Loans
B) Conventional Home Purchase Loans
C) Refinancings
D) Home Improvement Loans
F) Non-occupant Loans on < 5 Family Dwellings (A B C & D)
Number
Average Value
Number
Average Value
Number
Average Value
Number
Average Value
Number
Average Value
LOANS ORIGINATED
0
$0
35
$111,830
111
$82,829
34
$31,480
38
$115,458
APPLICATIONS APPROVED, NOT ACCEPTED
0
$0
7
$96,780
22
$81,474
6
$42,188
5
$153,344
APPLICATIONS DENIED
1
$108,280
17
$39,808
92
$68,540
23
$19,435
2
$89,255
APPLICATIONS WITHDRAWN
0
$0
3
$100,960
54
$73,566
7
$21,321
3
$77,307
FILES CLOSED FOR INCOMPLETENESS
1
$49,020
0
$0
10
$95,108
0
$0
1
$298,490
Aggregated Statistics For Year 2001 (Based on 2 partial tracts)
A) FHA, FSA/RHS & VA Home Purchase Loans
B) Conventional Home Purchase Loans
C) Refinancings
D) Home Improvement Loans
E) Loans on Dwellings For 5+ Families
F) Non-occupant Loans on < 5 Family Dwellings (A B C & D)
Number
Average Value
Number
Average Value
Number
Average Value
Number
Average Value
Number
Average Value
Number
Average Value
LOANS ORIGINATED
5
$64,674
40
$96,169
135
$67,047
50
$26,323
1
$16,830
37
$106,576
APPLICATIONS APPROVED, NOT ACCEPTED
0
$0
10
$62,040
35
$57,023
9
$19,753
0
$0
4
$71,880
APPLICATIONS DENIED
0
$0
32
$51,738
102
$56,513
51
$15,765
0
$0
7
$36,893
APPLICATIONS WITHDRAWN
0
$0
3
$78,527
41
$67,985
10
$20,485
0
$0
3
$81,940
FILES CLOSED FOR INCOMPLETENESS
0
$0
0
$0
14
$52,675
1
$18,290
0
$0
1
$42,430
Aggregated Statistics For Year 2000 (Based on 2 partial tracts)
A) FHA, FSA/RHS & VA Home Purchase Loans
B) Conventional Home Purchase Loans
C) Refinancings
D) Home Improvement Loans
F) Non-occupant Loans on < 5 Family Dwellings (A B C & D)
Number
Average Value
Number
Average Value
Number
Average Value
Number
Average Value
Number
Average Value
LOANS ORIGINATED
4
$77,550
39
$92,988
55
$48,631
41
$20,360
17
$117,228
APPLICATIONS APPROVED, NOT ACCEPTED
0
$0
8
$74,715
14
$67,934
7
$21,426
1
$109,010
APPLICATIONS DENIED
1
$87,790
31
$45,642
69
$54,658
21
$24,840
3
$75,353
APPLICATIONS WITHDRAWN
1
$31,460
2
$184,730
23
$51,594
2
$20,485
1
$177,780
FILES CLOSED FOR INCOMPLETENESS
0
$0
1
$37,310
6
$56,698
0
$0
0
$0
Aggregated Statistics For Year 1999 (Based on 1 partial tract)
A) FHA, FSA/RHS & VA Home Purchase Loans
B) Conventional Home Purchase Loans
C) Refinancings
D) Home Improvement Loans
F) Non-occupant Loans on < 5 Family Dwellings (A B C & D)
Detailed PMIC statistics for the following Tracts:2605.00
2004 - 2018 National Fire Incident Reporting System (NFIRS) incidents
According to the data from the years 2004 - 2018 the average number of fire incidents per year is 9. The highest number of reported fires - 25 took place in 2006, and the least - 0 in 2007. The data has a rising trend.
When looking into fire subcategories, the most reports belonged to: Structure Fires (60.0%), and Outside Fires (18.5%).
Fire incident types reported to NFIRS in Zip Code 15469


 Nearest zip codes: 15446, 15462, 15490, 15464, 15622, 15628.


 (Students: 248, Location: 14 SCHOOL HOUSE ROAD, Grades: KG-6)


 According to the data from the years 2004 - 2018 the average number of fire incidents per year is 9. The highest number of reported fires - 25 took place in 2006, and the least - 0 in 2007. The data has a rising trend.
 When looking into fire subcategories, the most reports belonged to: Structure Fires (60.0%), and Outside Fires (18.5%).