Estimated zip code population in 2022: 1,064 Zip code population in 2010: 975 Zip code population in 2000: 1,067
Houses and condos: 375 Renter-occupied apartments: 52
% of renters here:
15%
State:
31%
March 2022 cost of living index in zip code 16040: 87.6 (less than average, U.S. average is 100)
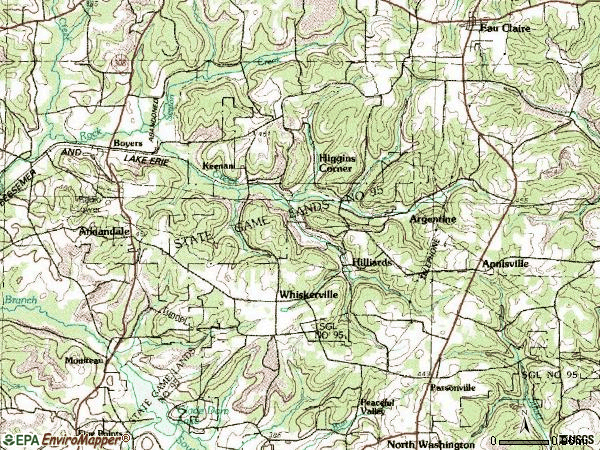
Land area: 19.6 sq. mi. Water area: 0.0 sq. mi.
Population density: 54 people per square mile
(very low).
OSM Map
General Map
Google Map
MSN Map
OSM Map
General Map
Google Map
MSN Map
OSM Map
General Map
Google Map
MSN Map
OSM Map
General Map
Google Map
MSN Map
Please wait while loading the map...
Real estate property taxes paid for housing units in 2022:
This zip code:
1.0% ($1,712)
Pennsylvania:
1.3% ($3,094)
Median real estate property taxes paid for housing units with mortgages in 2022: $1,483 (0.8%) Median real estate property taxes paid for housing units with no mortgage in 2022: $2,212 (1.3%)
Business Search- 14 Million verified businesses
Males: 589
(55.4%)
Females: 474
(44.6%)
For population 25 years and over in 16040:
High school or higher: 92.7%
Bachelor's degree or higher: 19.2%
Graduate or professional degree: 3.2%
Unemployed: 5.7%
Mean travel time to work (commute): 38.1 minutes
For population 15 years and over in 16040:
Never married: 39.4%
Now married: 47.0%
Separated: 0.6%
Widowed: 1.8%
Divorced: 11.2%
Zip code 16040 compared to state average:
Black race population percentage below state average.
Hispanic race population percentage significantly below state average.
Median age below state average.
Foreign-born population percentage significantly below state average.
Renting percentage below state average.
Length of stay since moving in significantly above state average.
Percentage of population with a bachelor's degree or higher below state average.
Averages for the 2020 tax year for zip code 16040, filed in 2021:
Average Adjusted Gross Income (AGI) in 2020: $52,217 (Individual Income Tax Returns)
Here:
$52,217
State:
$75,707
Salary/wage: $45,039 (reported on 80.9% of returns)
Here:
$45,039
State:
$62,806
(% of AGI for various income ranges: 1081.0% for AGIs below $25k, 3045.5% for AGIs $25k-50k, 6004.0% for AGIs $50k-75k, 8290.0% for AGIs $75k-100k, 12732.0% for AGIs $100k-200k)
Taxable interest for individuals: $273 (reported on 23.4% of returns)
This zip code:
$273
Pennsylvania:
$1,633
(% of AGI for various income ranges: 5.0% for AGIs below $25k, 4.5% for AGIs $25k-50k, 24.0% for AGIs $50k-75k, 16.0% for AGIs $100k-200k)
Ordinary dividends: $550 (reported on 12.8% of returns)
Here:
$550
State:
$7,382
(% of AGI for various income ranges: 11.8% for AGIs $25k-50k, 40.0% for AGIs $100k-200k)
Net capital gain/loss in AGI: +$800 (reported on 8.5% of returns)
Here:
+$800
State:
+$23,522
(% of AGI for various income ranges: 64.0% for AGIs $50k-75k)
Profit/loss from business: +$4,825 (reported on 8.5% of returns)
Here:
+$4,825
State:
+$16,274
(% of AGI for various income ranges: 175.5% for AGIs $25k-50k)
Taxable individual retirement arrangement distribution: $14,500 (reported on 8.5% of returns)
16040:
$14,500
Pennsylvania:
$18,583
(% of AGI for various income ranges: 1160.0% for AGIs $50k-75k)
Earned income credit: $1,929 (reported on 14.9% of returns)
Here:
$1,929
State:
$2,100
(% of AGI for various income ranges: 80.0% for AGIs below $25k, 50.0% for AGIs $25k-50k)
Percentage of individuals using paid preparers for their 2020 taxes: 91.5%
Here:
91%
State:
92%
(% for various income ranges: 86.7% for AGIs below $25k, 92.3% for AGIs $25k-50k, 100.0% for AGIs $50k-75k, 100.0% for AGIs $75k-100k, 85.7% for AGIs $100k-200k)
Averages for the 2012 tax year for zip code 16040, filed in 2013:
Average Adjusted Gross Income (AGI) in 2012: $57,734 (Individual Income Tax Returns)
Here:
$57,734
State:
$61,346
Salary/wage: $37,342 (reported on 81.8% of returns)
Here:
$37,342
State:
$51,902
(% of AGI for various income ranges: 75.9% for AGIs below $25k, 81.1% for AGIs $25k-50k, 71.4% for AGIs $50k-75k, 62.9% for AGIs $75k-100k, 32.0% for AGIs $100k-200k)
Taxable interest for individuals: $485 (reported on 29.5% of returns)
This zip code:
$485
Pennsylvania:
$1,588
(% of AGI for various income ranges: 0.2% for AGIs below $25k, 0.1% for AGIs $25k-50k, 0.2% for AGIs $50k-75k, 0.4% for AGIs $100k-200k)
Ordinary dividends: $500 (reported on 11.4% of returns)
Here:
$500
State:
$5,827
Net capital gain/loss in AGI: +$1,000 (reported on 6.8% of returns)
Here:
+$1,000
State:
+$14,495
Profit/loss from business: +$1,550 (reported on 9.1% of returns)
Here:
+$1,550
State:
+$16,268
Taxable individual retirement arrangement distribution: $3,733 (reported on 6.8% of returns)
16040:
$3,733
Pennsylvania:
$14,550
Total itemized deductions: $16,912 (14% of AGI, reported on 18.2% of returns)
Here:
$16,912
State:
$23,538
Here:
13.7% of AGI
State:
18.4% of AGI
Charity contributions: $3,050 (reported on 9.1% of returns)
Here:
$3,050
State:
$4,025
Taxes paid: $6,025 (reported on 18.2% of returns)
16040:
$6,025
State:
$9,982
Earned income credit: $2,229 (reported on 15.9% of returns)
Here:
$2,229
State:
$2,106
(% of AGI for various income ranges: 6.6% for AGIs below $25k, 0.8% for AGIs $25k-50k)
Percentage of individuals using paid preparers for their 2012 taxes: 54.5%
Here:
55%
State:
53%
(% for various income ranges: 47.1% for AGIs below $25k, 50.0% for AGIs $25k-50k, 57.1% for AGIs $50k-75k, 50.0% for AGIs $75k-100k, 83.3% for AGIs $100k-200k)
Averages for the 2004 tax year for zip code 16040, filed in 2005:
Average Adjusted Gross Income (AGI) in 2004: $34,209 (Individual Income Tax Returns)
Here:
$34,209
State:
$48,049
Salary/wage: $30,576 (reported on 83.2% of returns)
Here:
$30,576
State:
$42,646
(% of AGI for various income ranges: 72.4% for AGIs below $10k, 71.1% for AGIs $10k-25k, 74.8% for AGIs $25k-50k, 85.2% for AGIs $50k-75k, 110.6% for AGIs $75k-100k)
Taxable interest for individuals: $385 (reported on 42.3% of returns)
This zip code:
$385
Pennsylvania:
$1,657
(% of AGI for various income ranges: 2.4% for AGIs below $10k, 1.2% for AGIs $10k-25k, 0.4% for AGIs $25k-50k, 0.2% for AGIs $50k-75k, 0.6% for AGIs $75k-100k)
Taxable dividends: $517 (reported on 14.1% of returns)
Here:
$517
State:
$3,566
(% of AGI for various income ranges: 0.7% for AGIs $10k-25k, 0.3% for AGIs $25k-50k, 0.1% for AGIs $50k-75k, 0.1% for AGIs $75k-100k)
Net capital gain/loss: +$1,400 (reported on 4.9% of returns)
Here:
+$1,400
State:
+$9,716
Profit/loss from business: +$5,304 (reported on 11.2% of returns)
Here:
+$5,304
State:
+$14,267
Total itemized deductions: $12,431 (23% of AGI, reported on 15.8% of returns)
Here:
$12,431
State:
$18,804
Here:
23.3% of AGI
State:
19.5% of AGI
(% of AGI for various income ranges: 5.3% for AGIs $10k-25k, 5.1% for AGIs $25k-50k, 7.6% for AGIs $50k-75k, 8.7% for AGIs $75k-100k)
Charity contributions deductions: $1,235 (2% of AGI, reported on 12.4% of returns)
Here:
$1,235
State:
$3,337
Here:
2.2% of AGI
State:
3.3% of AGI
Total tax: $4,123 (reported on 73.2% of returns)
16040:
$4,123
State:
$8,008
(% of AGI for various income ranges: 2.7% for AGIs below $10k, 4.1% for AGIs $10k-25k, 6.3% for AGIs $25k-50k, 9.7% for AGIs $50k-75k, 10.1% for AGIs $75k-100k, 17.8% for AGIs over 100k)
Earned income credit: $1,805 (reported on 18.7% of returns)
Here:
$1,805
State:
$1,643
Percentage of individuals using paid preparers for their 2004 taxes: 56.9%
Here:
57%
State:
56%
(% for various income ranges: 42.5% for AGIs below $10k, 67.5% for AGIs $10k-25k, 57.0% for AGIs $25k-50k, 52.1% for AGIs $50k-75k, 91.7% for AGIs $75k-100k)
Likely homosexual households (counted as self-reported same-sex unmarried-partner households)
Lesbian couples: 0.0% of all households
Gay men: 0.8% of all households
Household received Food Stamps/SNAP in the past 12 months: 11 Household did not receive Food Stamps/SNAP in the past 12 months: 337
Women who did not have a birth in the past 12 months: 271 (107 now married, 164 unmarried)
Housing units in zip code 16040 with a mortgage: 131 (16 second mortgage, 16 both second mortgage and home equity loan) Median monthly owner costs for units with a mortgage: $1,111 Median monthly owner costs for units without a mortgage: $508
Residents with income below the poverty level in 2022:
This zip code:
2.6%
Whole state:
11.8%
Residents with income below 50% of the poverty level in 2022:
This zip code:
1.2%
Whole state:
6.1%
Median number of rooms in houses and condos:
Here:
6.4
State:
6.8
Median number of rooms in apartments:
Here:
5.0
State:
4.3
Notable locations in this zip code not listed on our city pages
Size of family households: 91 2-persons, 40 3-persons, 75 4-persons, 8 5-persons, 28 6-persons, 8 7-or-more-persons
Size of nonfamily households: 83 1-person, 12 2-persons
142 married couples with children.
93 single-parent households (22 men, 71 women).
98.6% of residents of 16040 zip code speak English at home.
0.3% of residents speak other Indo-European language at home (100% very well).
Foreign born population: 0 (0.0%)
:
0.0%
Whole state:
7.5%
30%German
18%American
9%Irish
5%Scotch-Irish
4%European
3%Polish
2%Italian
Housing units lacking complete plumbing facilities: 4.2% Housing units lacking complete kitchen facilities: 0.7%
46.0%Utility gas
17.8%Bottled, tank, or LP gas
15.1%Fuel oil, kerosene, etc.
9.9%Electricity
8.4%Wood
2.3%Other fuel
0.9%Coal or coke
Population in 1990: 1,092.
Place of birth for U.S.-born residents:
This state: 997
Northeast: 32
Midwest: 6
South: 17
71% of the 16040 zip code residents lived in the same house 5 years ago. Out of people who lived in different houses, 76% lived in this county. Out of people who lived in different counties, 50% lived in Pennsylvania.
100% of the 16040 zip code residents lived in the same house 1 year ago.
Private vs. public school enrollment:
Students in private schools in grades 1 to 8 (elementary and middle school): 9
Here:
6.5%
Pennsylvania:
15.7%
Students in private schools in grades 9 to 12 (high school): 16
Here:
19.4%
Pennsylvania:
13.4%
Students in private undergraduate colleges: 5
Here:
10.5%
Pennsylvania:
39.8%
Occupation by median earnings in the past 12 months ($)
88,804Computer and mathematical occupations
81,119Health diagnosing and treating practitioners and other technical occupations
72,792Fire fighting and prevention, and other protective service workers including supervisors
59,390Material moving occupations
56,455Business and financial operations occupations
55,078Management occupations
Companies with federal contracts located in this zip code:
KIRSCHNER, CLAYTON (2137 WEST SUNBURY ROAD in HILLIARDS, PA; small business)
$5,500 with Army for Technical Assistance. Taking place in MA. Signed on 2006-05-24. Completion date: 2006-09-01.
Top industries in this zip code by the number of employees in 2005:
Construction: Commercial and Institutional Building Construction (5-9 employees: 1 establishment)
Accommodation and Food Services: Drinking Places (Alcoholic Beverages) (1-4: 1)
Construction: Site Preparation Contractors (1-4: 1)
Construction: Painting and Wall Covering Contractors (1-4: 1)
Construction: Framing Contractors (1-4: 1)
People in group quarters in 2000:
11 people in other group homes
Fatal accident statistics in 2011:
Fatal accident count: 1
Vehicles involved in fatal accidents: 1
Fatal accidents caused by drunken drivers: 1
Fatalities: 1
Persons involved in fatal accidents: 1
Pedestrians involved in fatal accidents: 0
Home Mortgage Disclosure Act Aggregated Statistics For Year 2009 (Based on 2 partial tracts)
A) FHA, FSA/RHS & VA Home Purchase Loans
B) Conventional Home Purchase Loans
C) Refinancings
D) Home Improvement Loans
F) Non-occupant Loans on < 5 Family Dwellings (A B C & D)
G) Loans On Manufactured Home Dwelling (A B C & D)
Number
Average Value
Number
Average Value
Number
Average Value
Number
Average Value
Number
Average Value
Number
Average Value
LOANS ORIGINATED
5
$122,202
6
$85,985
26
$110,491
8
$17,785
2
$70,575
5
$78,198
APPLICATIONS APPROVED, NOT ACCEPTED
0
$0
2
$72,460
3
$97,620
0
$0
0
$0
1
$100,010
APPLICATIONS DENIED
2
$88,880
4
$75,292
19
$110,995
5
$39,400
2
$51,705
6
$66,045
APPLICATIONS WITHDRAWN
1
$89,070
2
$39,815
12
$130,895
1
$30,950
1
$58,500
2
$71,140
FILES CLOSED FOR INCOMPLETENESS
0
$0
1
$47,550
2
$71,330
0
$0
0
$0
0
$0
Aggregated Statistics For Year 2008 (Based on 2 partial tracts)
A) FHA, FSA/RHS & VA Home Purchase Loans
B) Conventional Home Purchase Loans
C) Refinancings
D) Home Improvement Loans
F) Non-occupant Loans on < 5 Family Dwellings (A B C & D)
G) Loans On Manufactured Home Dwelling (A B C & D)
Number
Average Value
Number
Average Value
Number
Average Value
Number
Average Value
Number
Average Value
Number
Average Value
LOANS ORIGINATED
2
$82,460
9
$104,414
27
$88,773
12
$33,840
2
$60,005
6
$41,388
APPLICATIONS APPROVED, NOT ACCEPTED
0
$0
2
$182,850
3
$91,330
1
$55,480
0
$0
1
$30,950
APPLICATIONS DENIED
0
$0
4
$59,440
29
$111,164
9
$49,481
0
$0
7
$64,320
APPLICATIONS WITHDRAWN
1
$135,860
1
$46,040
10
$110,654
1
$69,060
0
$0
2
$109,070
FILES CLOSED FOR INCOMPLETENESS
0
$0
0
$0
0
$0
0
$0
0
$0
0
$0
Aggregated Statistics For Year 2007 (Based on 2 partial tracts)
A) FHA, FSA/RHS & VA Home Purchase Loans
B) Conventional Home Purchase Loans
C) Refinancings
D) Home Improvement Loans
F) Non-occupant Loans on < 5 Family Dwellings (A B C & D)
G) Loans On Manufactured Home Dwelling (A B C & D)
Number
Average Value
Number
Average Value
Number
Average Value
Number
Average Value
Number
Average Value
Number
Average Value
LOANS ORIGINATED
2
$96,615
16
$80,693
30
$98,413
21
$29,527
4
$76,422
6
$64,095
APPLICATIONS APPROVED, NOT ACCEPTED
0
$0
4
$94,632
8
$117,701
2
$45,290
1
$61,890
2
$102,275
APPLICATIONS DENIED
0
$0
10
$102,464
41
$125,711
9
$36,021
2
$80,200
6
$93,407
APPLICATIONS WITHDRAWN
0
$0
2
$70,195
9
$137,709
1
$32,080
0
$0
0
$0
FILES CLOSED FOR INCOMPLETENESS
0
$0
1
$95,100
2
$179,455
0
$0
0
$0
0
$0
Aggregated Statistics For Year 2006 (Based on 2 partial tracts)
A) FHA, FSA/RHS & VA Home Purchase Loans
B) Conventional Home Purchase Loans
C) Refinancings
D) Home Improvement Loans
F) Non-occupant Loans on < 5 Family Dwellings (A B C & D)
G) Loans On Manufactured Home Dwelling (A B C & D)
Number
Average Value
Number
Average Value
Number
Average Value
Number
Average Value
Number
Average Value
Number
Average Value
LOANS ORIGINATED
1
$81,520
21
$84,987
40
$86,934
19
$29,993
2
$76,800
10
$79,820
APPLICATIONS APPROVED, NOT ACCEPTED
0
$0
3
$79,883
4
$130,202
2
$51,895
0
$0
2
$29,250
APPLICATIONS DENIED
0
$0
6
$58,245
46
$100,856
15
$47,879
1
$48,310
11
$53,934
APPLICATIONS WITHDRAWN
0
$0
3
$141,777
14
$97,612
2
$76,425
1
$134,730
2
$73,970
FILES CLOSED FOR INCOMPLETENESS
0
$0
0
$0
3
$89,317
0
$0
0
$0
0
$0
Aggregated Statistics For Year 2005 (Based on 2 partial tracts)
A) FHA, FSA/RHS & VA Home Purchase Loans
B) Conventional Home Purchase Loans
C) Refinancings
D) Home Improvement Loans
F) Non-occupant Loans on < 5 Family Dwellings (A B C & D)
G) Loans On Manufactured Home Dwelling (A B C & D)
Number
Average Value
Number
Average Value
Number
Average Value
Number
Average Value
Number
Average Value
Number
Average Value
LOANS ORIGINATED
2
$103,220
25
$70,362
38
$78,807
17
$44,111
2
$21,890
12
$65,322
APPLICATIONS APPROVED, NOT ACCEPTED
0
$0
3
$68,310
6
$75,920
2
$28,870
0
$0
3
$35,097
APPLICATIONS DENIED
0
$0
8
$59,818
42
$89,300
9
$31,660
2
$18,680
9
$48,098
APPLICATIONS WITHDRAWN
1
$64,910
2
$58,120
20
$94,104
4
$76,800
0
$0
2
$89,065
FILES CLOSED FOR INCOMPLETENESS
0
$0
0
$0
5
$91,256
1
$36,990
0
$0
0
$0
Aggregated Statistics For Year 2004 (Based on 2 partial tracts)
A) FHA, FSA/RHS & VA Home Purchase Loans
B) Conventional Home Purchase Loans
C) Refinancings
D) Home Improvement Loans
F) Non-occupant Loans on < 5 Family Dwellings (A B C & D)
G) Loans On Manufactured Home Dwelling (A B C & D)
Number
Average Value
Number
Average Value
Number
Average Value
Number
Average Value
Number
Average Value
Number
Average Value
LOANS ORIGINATED
2
$81,330
15
$94,778
41
$77,606
16
$24,743
2
$29,625
5
$73,518
APPLICATIONS APPROVED, NOT ACCEPTED
1
$78,120
1
$83,030
7
$84,537
2
$22,265
0
$0
2
$85,860
APPLICATIONS DENIED
0
$0
8
$59,865
40
$84,396
9
$38,243
2
$40,380
6
$75,228
APPLICATIONS WITHDRAWN
0
$0
2
$114,540
27
$88,885
3
$32,330
0
$0
2
$57,740
FILES CLOSED FOR INCOMPLETENESS
0
$0
1
$140,390
10
$107,295
1
$32,830
0
$0
0
$0
Aggregated Statistics For Year 2003 (Based on 2 partial tracts)
B) Conventional Home Purchase Loans
C) Refinancings
D) Home Improvement Loans
F) Non-occupant Loans on < 5 Family Dwellings (A B C & D)
Number
Average Value
Number
Average Value
Number
Average Value
Number
Average Value
LOANS ORIGINATED
18
$83,594
72
$82,200
13
$21,454
3
$59,757
APPLICATIONS APPROVED, NOT ACCEPTED
3
$33,840
18
$82,084
1
$106,050
0
$0
APPLICATIONS DENIED
6
$60,510
49
$87,957
7
$12,831
2
$36,420
APPLICATIONS WITHDRAWN
4
$73,310
15
$85,947
2
$23,590
0
$0
FILES CLOSED FOR INCOMPLETENESS
0
$0
0
$0
0
$0
0
$0
Aggregated Statistics For Year 2002 (Based on 2 partial tracts)
A) FHA, FSA/RHS & VA Home Purchase Loans
B) Conventional Home Purchase Loans
C) Refinancings
D) Home Improvement Loans
F) Non-occupant Loans on < 5 Family Dwellings (A B C & D)
Number
Average Value
Number
Average Value
Number
Average Value
Number
Average Value
Number
Average Value
LOANS ORIGINATED
2
$75,670
15
$70,951
45
$73,585
21
$23,021
3
$32,707
APPLICATIONS APPROVED, NOT ACCEPTED
0
$0
3
$61,517
15
$77,694
1
$42,650
1
$75,860
APPLICATIONS DENIED
0
$0
11
$56,301
43
$69,292
8
$32,315
3
$67,430
APPLICATIONS WITHDRAWN
0
$0
6
$62,460
24
$81,644
2
$38,685
0
$0
FILES CLOSED FOR INCOMPLETENESS
0
$0
1
$38,870
6
$83,593
0
$0
0
$0
Aggregated Statistics For Year 2001 (Based on 2 partial tracts)
A) FHA, FSA/RHS & VA Home Purchase Loans
B) Conventional Home Purchase Loans
C) Refinancings
D) Home Improvement Loans
F) Non-occupant Loans on < 5 Family Dwellings (A B C & D)
Number
Average Value
Number
Average Value
Number
Average Value
Number
Average Value
Number
Average Value
LOANS ORIGINATED
0
$0
14
$71,760
52
$63,839
18
$20,379
2
$56,420
APPLICATIONS APPROVED, NOT ACCEPTED
0
$0
5
$68,838
20
$57,799
4
$23,115
0
$0
APPLICATIONS DENIED
1
$56,230
11
$56,815
51
$61,057
9
$16,396
2
$37,550
APPLICATIONS WITHDRAWN
0
$0
3
$39,627
29
$80,022
3
$14,090
1
$37,740
FILES CLOSED FOR INCOMPLETENESS
0
$0
0
$0
4
$62,932
1
$19,620
0
$0
Aggregated Statistics For Year 2000 (Based on 2 partial tracts)
A) FHA, FSA/RHS & VA Home Purchase Loans
B) Conventional Home Purchase Loans
C) Refinancings
D) Home Improvement Loans
F) Non-occupant Loans on < 5 Family Dwellings (A B C & D)
Number
Average Value
Number
Average Value
Number
Average Value
Number
Average Value
Number
Average Value
LOANS ORIGINATED
2
$42,645
21
$56,646
26
$56,813
20
$19,191
3
$49,817
APPLICATIONS APPROVED, NOT ACCEPTED
0
$0
8
$63,072
11
$57,159
5
$16,756
1
$53,970
APPLICATIONS DENIED
0
$0
23
$45,419
30
$58,497
8
$34,815
0
$0
APPLICATIONS WITHDRAWN
0
$0
2
$48,495
18
$55,541
2
$11,320
0
$0
FILES CLOSED FOR INCOMPLETENESS
0
$0
1
$35,850
3
$66,297
0
$0
0
$0
Aggregated Statistics For Year 1999 (Based on 1 partial tract)
A) FHA, FSA/RHS & VA Home Purchase Loans
B) Conventional Home Purchase Loans
C) Refinancings
D) Home Improvement Loans
F) Non-occupant Loans on < 5 Family Dwellings (A B C & D)

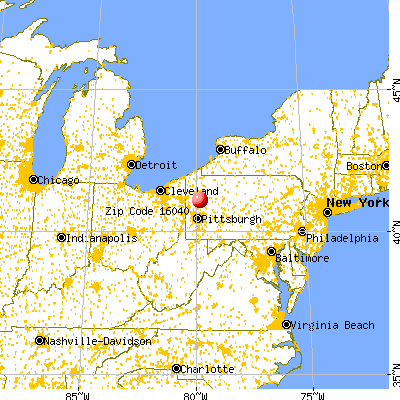


 Nearest zip codes: 16048, 16030, 16020, 16050, 16061, 16372.