Estimated zip code population in 2022: 929 Zip code population in 2010: 1,546 Zip code population in 2000: 1,625
Houses and condos: 499 Renter-occupied apartments: 79
% of renters here:
18%
State:
31%
March 2022 cost of living index in zip code 16050: 88.0 (less than average, U.S. average is 100)
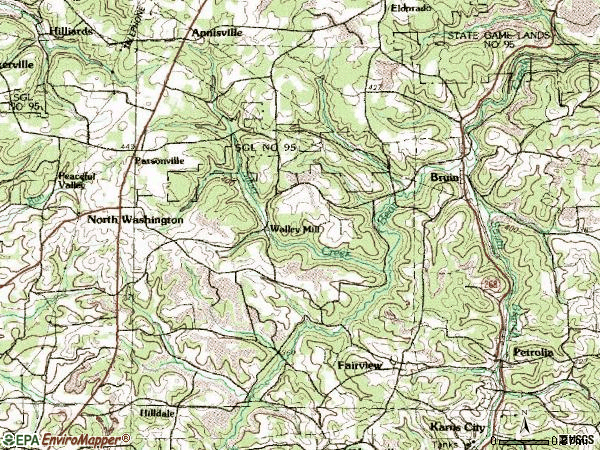
Land area: 24.6 sq. mi. Water area: 0.0 sq. mi.
Population density: 38 people per square mile
(very low).
OSM Map
General Map
Google Map
MSN Map
OSM Map
General Map
Google Map
MSN Map
OSM Map
General Map
Google Map
MSN Map
OSM Map
General Map
Google Map
MSN Map
Please wait while loading the map...
Real estate property taxes paid for housing units in 2022:
This zip code:
1.1% ($1,459)
Pennsylvania:
1.3% ($3,094)
Median real estate property taxes paid for housing units with mortgages in 2022: $1,647 (1.2%) Median real estate property taxes paid for housing units with no mortgage in 2022: $1,258 (1.0%)
Averages for the 2020 tax year for zip code 16050, filed in 2021:
Average Adjusted Gross Income (AGI) in 2020: $51,819 (Individual Income Tax Returns)
Here:
$51,819
State:
$75,707
Salary/wage: $46,119 (reported on 78.3% of returns)
Here:
$46,119
State:
$62,806
(% of AGI for various income ranges: 1049.3% for AGIs below $25k, 3182.8% for AGIs $25k-50k, 4885.0% for AGIs $50k-75k, 8704.0% for AGIs $75k-100k, 15743.3% for AGIs $100k-200k)
Taxable interest for individuals: $275 (reported on 29.0% of returns)
This zip code:
$275
Pennsylvania:
$1,633
(% of AGI for various income ranges: 5.7% for AGIs below $25k, 10.0% for AGIs $25k-50k, 12.5% for AGIs $50k-75k, 18.0% for AGIs $75k-100k, 16.7% for AGIs $100k-200k)
Ordinary dividends: $2,400 (reported on 17.4% of returns)
Here:
$2,400
State:
$7,382
(% of AGI for various income ranges: 25.0% for AGIs below $25k, 54.4% for AGIs $25k-50k, 96.2% for AGIs $50k-75k, 130.0% for AGIs $100k-200k)
Net capital gain/loss in AGI: +$2,950 (reported on 14.5% of returns)
Here:
+$2,950
State:
+$23,522
(% of AGI for various income ranges: 26.4% for AGIs below $25k, 68.8% for AGIs $50k-75k, 338.3% for AGIs $100k-200k)
Profit/loss from business: +$4,017 (reported on 8.7% of returns)
Here:
+$4,017
State:
+$16,274
(% of AGI for various income ranges: 113.3% for AGIs $25k-50k, 74.0% for AGIs $75k-100k)
Taxable individual retirement arrangement distribution: $9,500 (reported on 11.6% of returns)
16050:
$9,500
Pennsylvania:
$18,583
(% of AGI for various income ranges: 243.3% for AGIs $25k-50k, 644.0% for AGIs $75k-100k)
Earned income credit: $2,089 (reported on 13.0% of returns)
Here:
$2,089
State:
$2,100
(% of AGI for various income ranges: 70.7% for AGIs below $25k, 49.4% for AGIs $25k-50k)
Percentage of individuals using paid preparers for their 2020 taxes: 95.7%
Here:
96%
State:
92%
(% for various income ranges: 95.2% for AGIs below $25k, 95.5% for AGIs $25k-50k, 100.0% for AGIs $50k-75k, 100.0% for AGIs $75k-100k, 88.9% for AGIs $100k-200k)
Averages for the 2012 tax year for zip code 16050, filed in 2013:
Average Adjusted Gross Income (AGI) in 2012: $51,857 (Individual Income Tax Returns)
Here:
$51,857
State:
$61,346
Salary/wage: $41,311 (reported on 80.6% of returns)
Here:
$41,311
State:
$51,902
(% of AGI for various income ranges: 67.5% for AGIs below $25k, 74.0% for AGIs $25k-50k, 76.9% for AGIs $50k-75k, 83.2% for AGIs $75k-100k, 46.7% for AGIs $100k-200k)
Taxable interest for individuals: $367 (reported on 31.3% of returns)
This zip code:
$367
Pennsylvania:
$1,588
(% of AGI for various income ranges: 0.9% for AGIs below $25k, 0.2% for AGIs $25k-50k, 0.1% for AGIs $50k-75k, 0.2% for AGIs $75k-100k, 0.1% for AGIs $100k-200k)
Ordinary dividends: $1,427 (reported on 16.4% of returns)
Here:
$1,427
State:
$5,827
(% of AGI for various income ranges: 1.1% for AGIs below $25k, 0.8% for AGIs $25k-50k, 0.8% for AGIs $50k-75k, 0.2% for AGIs $100k-200k)
Net capital gain/loss in AGI: +$1,883 (reported on 9.0% of returns)
Here:
+$1,883
State:
+$14,495
Profit/loss from business: +$5,271 (reported on 10.4% of returns)
Here:
+$5,271
State:
+$16,268
Taxable individual retirement arrangement distribution: $7,767 (reported on 9.0% of returns)
16050:
$7,767
Pennsylvania:
$14,550
Total itemized deductions: $16,173 (15% of AGI, reported on 16.4% of returns)
Here:
$16,173
State:
$23,538
Here:
14.6% of AGI
State:
18.4% of AGI
(% of AGI for various income ranges: 11.8% for AGIs below $25k, 10.3% for AGIs $50k-75k, 5.1% for AGIs $100k-200k)
Charity contributions: $1,300 (reported on 7.5% of returns)
Here:
$1,300
State:
$4,025
Taxes paid: $5,845 (reported on 16.4% of returns)
16050:
$5,845
State:
$9,982
(% of AGI for various income ranges: 2.1% for AGIs below $25k, 2.9% for AGIs $50k-75k, 2.7% for AGIs $100k-200k)
Earned income credit: $2,309 (reported on 16.4% of returns)
Here:
$2,309
State:
$2,106
(% of AGI for various income ranges: 5.4% for AGIs below $25k, 1.3% for AGIs $25k-50k)
Percentage of individuals using paid preparers for their 2012 taxes: 59.7%
Here:
60%
State:
53%
(% for various income ranges: 52.0% for AGIs below $25k, 58.8% for AGIs $25k-50k, 63.6% for AGIs $50k-75k, 66.7% for AGIs $75k-100k, 75.0% for AGIs $100k-200k)
Averages for the 2004 tax year for zip code 16050, filed in 2005:
Average Adjusted Gross Income (AGI) in 2004: $34,981 (Individual Income Tax Returns)
Here:
$34,981
State:
$48,049
Salary/wage: $33,859 (reported on 84.4% of returns)
Here:
$33,859
State:
$42,646
(% of AGI for various income ranges: 81.4% for AGIs below $10k, 67.0% for AGIs $10k-25k, 81.1% for AGIs $25k-50k, 88.1% for AGIs $50k-75k, 87.2% for AGIs $75k-100k, 77.1% for AGIs over 100k)
Taxable interest for individuals: $684 (reported on 44.1% of returns)
This zip code:
$684
Pennsylvania:
$1,657
(% of AGI for various income ranges: 3.2% for AGIs below $10k, 2.0% for AGIs $10k-25k, 1.2% for AGIs $25k-50k, 0.4% for AGIs $50k-75k, 0.3% for AGIs $75k-100k, 0.2% for AGIs over 100k)
Taxable dividends: $886 (reported on 19.7% of returns)
Here:
$886
State:
$3,566
(% of AGI for various income ranges: 0.6% for AGIs below $10k, 1.4% for AGIs $10k-25k, 0.6% for AGIs $25k-50k, 0.3% for AGIs $50k-75k, 0.2% for AGIs $75k-100k)
Net capital gain/loss: +$864 (reported on 13.0% of returns)
Here:
+$864
State:
+$9,716
(% of AGI for various income ranges: 0.6% for AGIs below $10k, 0.5% for AGIs $10k-25k, 0.1% for AGIs $25k-50k, 0.7% for AGIs $50k-75k, 0.1% for AGIs $75k-100k)
Profit/loss from business: +$2,123 (reported on 10.4% of returns)
Here:
+$2,123
State:
+$14,267
(% of AGI for various income ranges: 9.8% for AGIs below $10k, 3.9% for AGIs $10k-25k, -1.4% for AGIs $25k-50k, 0.9% for AGIs $50k-75k)
Total itemized deductions: $11,979 (20% of AGI, reported on 15.6% of returns)
Here:
$11,979
State:
$18,804
Here:
20.4% of AGI
State:
19.5% of AGI
(% of AGI for various income ranges: 4.8% for AGIs $10k-25k, 4.3% for AGIs $25k-50k, 6.9% for AGIs $50k-75k, 8.7% for AGIs $75k-100k)
Charity contributions deductions: $1,493 (2% of AGI, reported on 12.0% of returns)
Here:
$1,493
State:
$3,337
Here:
2.4% of AGI
State:
3.3% of AGI
(% of AGI for various income ranges: 3.0% for AGIs below $10k, 0.4% for AGIs $25k-50k, 0.6% for AGIs $50k-75k, 0.9% for AGIs $75k-100k)
Total tax: $3,925 (reported on 75.3% of returns)
16050:
$3,925
State:
$8,008
(% of AGI for various income ranges: 2.8% for AGIs below $10k, 4.2% for AGIs $10k-25k, 6.0% for AGIs $25k-50k, 8.2% for AGIs $50k-75k, 10.3% for AGIs $75k-100k, 18.0% for AGIs over 100k)
Earned income credit: $1,609 (reported on 17.7% of returns)
Here:
$1,609
State:
$1,643
Percentage of individuals using paid preparers for their 2004 taxes: 56.8%
Here:
57%
State:
56%
(% for various income ranges: 50.4% for AGIs below $10k, 55.7% for AGIs $10k-25k, 51.8% for AGIs $25k-50k, 68.8% for AGIs $50k-75k, 63.3% for AGIs $75k-100k, 73.7% for AGIs over 100k)
Household received Food Stamps/SNAP in the past 12 months: 49 Household did not receive Food Stamps/SNAP in the past 12 months: 382
Women who had a birth in the past 12 months: 5 (4 now married, 0 unmarried) Women who did not have a birth in the past 12 months: 168 (76 now married, 90 unmarried)
Housing units in zip code 16050 with a mortgage: 158 (9 second mortgage, 9 both second mortgage and home equity loan) Houses without a mortgage: 14
Median monthly owner costs for units with a mortgage: $939 Median monthly owner costs for units without a mortgage: $370
Residents with income below the poverty level in 2022:
This zip code:
10.7%
Whole state:
11.8%
Residents with income below 50% of the poverty level in 2022:
This zip code:
8.5%
Whole state:
6.1%
Median number of rooms in houses and condos:
Here:
6.1
State:
6.8
Median number of rooms in apartments:
Here:
5.3
State:
4.3
Notable locations in this zip code not listed on our city pages
Size of family households: 144 2-persons, 35 3-persons, 48 4-persons, 22 5-persons, 4 7-or-more-persons
Size of nonfamily households: 153 1-person, 26 2-persons
111 married couples with children.
32 single-parent households (32 women).
95.8% of residents of 16050 zip code speak English at home.
1.4% of residents speak Spanish at home (15% very well, 85% well).
1.0% of residents speak other Indo-European language at home (78% very well, 22% well).
1.0% of residents speak Asian or Pacific Island language at home (78% very well, 22% not at all).
Foreign born population: 12 (1.3%) (59.3% of them are naturalized citizens)
This zip code:
1.3%
Whole state:
7.5%
58%Bhutan
25%France
27%German
20%Irish
15%American
7%English
4%Polish
2%Scotch-Irish
2%Greek
Year of entry for the foreign-born population
32010 or later
02000 to 2009
101990 to 1999
3Before 1990
Facilities with environmental interests located in this zip code:
BEAZER EAST PETROLIA GROUNDWATER TRMT PLT (STATE ROUTE 268 in PETROLIA, PA)
STATE MASTER (Pennsylvania database) - PCS-PA0210218, National Pollutant Discharge Elimination System Permit National Pollutant Discharge Elimination System NON-MAJOR (Tracking pollutant discharge elimination systems) - permit Business SIC classification: CYCLIC ORGANIC CRUDES AND INTERMEDIATES, AND ORGANIC DYES AND PIGMENTS Organizations: BEAZER EAST, INC. (CONTACT/OWNER)
Alternative names: BEAZER EAST INC.
BEAR CREEK WATERSHED AUTH STP (259 ARGYLE ST in PETROLIA, PA)
STATE MASTER (Pennsylvania database) - PCS-PA0239712, National Pollutant Discharge Elimination System Permit, PCS-PA0239721, PCS-PA0239739, National Pollutant Discharge Elimination System NON-MAJOR (Tracking pollutant discharge elimination systems) - permit Business SIC classification: SEWERAGE SYSTEMS
BEAR CREEK WATERSHED AUTHORITY (FAIRVIEW STP in PETROLIA, PA)
National Pollutant Discharge Elimination System NON-MAJOR (Tracking pollutant discharge elimination systems) - permit Business SIC classification: SEWERAGE SYSTEMS
Housing units lacking complete plumbing facilities: 1.8% Housing units lacking complete kitchen facilities: 3.7%
78.5%Utility gas
6.1%Bottled, tank, or LP gas
5.9%Electricity
4.5%Wood
4.0%Fuel oil, kerosene, etc.
0.9%Other fuel
Population in 1990: 491. Population change in the 1990s: +1,134 (+231.0%).
Place of birth for U.S.-born residents:
This state: 827
Northeast: 17
Midwest: 32
South: 15
West: 11
71% of the 16050 zip code residents lived in the same house 5 years ago. Out of people who lived in different houses, 65% lived in this county. Out of people who lived in different counties, 50% lived in Pennsylvania.
96% of the 16050 zip code residents lived in the same house 1 year ago. Out of people who lived in different houses, 50% moved from this county. Out of people who lived in different houses, 23% moved from different county within same state. Out of people who lived in different houses, 35% moved from different state.
Private vs. public school enrollment:
Students in private schools in grades 1 to 8 (elementary and middle school): 4
Here:
6.7%
Pennsylvania:
15.7%
Students in private schools in grades 9 to 12 (high school):
Here:
0.0%
Pennsylvania:
13.4%
Students in private undergraduate colleges:
Here:
0.0%
Pennsylvania:
39.8%
Occupation by median earnings in the past 12 months ($)
75,029Community and social service occupations
72,770Computer and mathematical occupations
69,749Construction and extraction occupations
62,298Management occupations
57,739Production occupations
55,543Transportation occupations
Top industries in this zip code by the number of employees in 2005:
Construction: Other Heavy and Civil Engineering Construction (20-49 employees: 1 establishment)
Construction: Highway, Street, and Bridge Construction (20-49: 1)
Construction: Masonry Contractors (5-9: 1)
Accommodation and Food Services: Full-Service Restaurants (5-9: 1)
Health Care and Social Assistance: Offices of Physicians (except Mental Health Specialists) (5-9: 1)
Health Care and Social Assistance: Ambulance Services (5-9: 1)
Accommodation and Food Services: Drinking Places (Alcoholic Beverages) (1-4: 2)
Fatal accident statistics in 2014:
Fatal accident count: 1
Vehicles involved in fatal accidents: 1
Fatal accidents caused by drunken drivers: 0
Fatalities: 1
Persons involved in fatal accidents: 1
Pedestrians involved in fatal accidents: 1
Fatal accident statistics in 2013:
Fatal accident count: 1
Vehicles involved in fatal accidents: 1
Fatal accidents caused by drunken drivers: 1
Fatalities: 1
Persons involved in fatal accidents: 1
Pedestrians involved in fatal accidents: 0
Home Mortgage Disclosure Act Aggregated Statistics For Year 2009 (Based on 2 partial tracts)
A) FHA, FSA/RHS & VA Home Purchase Loans
B) Conventional Home Purchase Loans
C) Refinancings
D) Home Improvement Loans
F) Non-occupant Loans on < 5 Family Dwellings (A B C & D)
G) Loans On Manufactured Home Dwelling (A B C & D)
Number
Average Value
Number
Average Value
Number
Average Value
Number
Average Value
Number
Average Value
Number
Average Value
LOANS ORIGINATED
4
$106,145
6
$78,827
23
$111,430
7
$42,873
1
$32,960
1
$42,070
APPLICATIONS APPROVED, NOT ACCEPTED
0
$0
0
$0
2
$119,905
0
$0
0
$0
0
$0
APPLICATIONS DENIED
0
$0
1
$17,880
15
$83,396
4
$33,570
1
$58,900
2
$47,680
APPLICATIONS WITHDRAWN
0
$0
1
$75,380
9
$97,544
1
$30,850
1
$35,060
1
$62,760
FILES CLOSED FOR INCOMPLETENESS
0
$0
0
$0
2
$103,600
1
$17,880
0
$0
1
$61,360
Aggregated Statistics For Year 2008 (Based on 2 partial tracts)
A) FHA, FSA/RHS & VA Home Purchase Loans
B) Conventional Home Purchase Loans
C) Refinancings
D) Home Improvement Loans
F) Non-occupant Loans on < 5 Family Dwellings (A B C & D)
G) Loans On Manufactured Home Dwelling (A B C & D)
Number
Average Value
Number
Average Value
Number
Average Value
Number
Average Value
Number
Average Value
Number
Average Value
LOANS ORIGINATED
3
$85,780
9
$82,898
18
$90,202
12
$21,854
1
$65,210
3
$70,353
APPLICATIONS APPROVED, NOT ACCEPTED
0
$0
3
$62,523
2
$44,350
1
$23,490
0
$0
1
$66,960
APPLICATIONS DENIED
1
$59,600
2
$56,795
23
$101,583
7
$28,649
1
$36,810
4
$84,320
APPLICATIONS WITHDRAWN
1
$100,970
2
$65,035
6
$115,698
1
$109,040
0
$0
1
$73,980
FILES CLOSED FOR INCOMPLETENESS
0
$0
0
$0
1
$37,510
0
$0
0
$0
0
$0
Aggregated Statistics For Year 2007 (Based on 2 partial tracts)
A) FHA, FSA/RHS & VA Home Purchase Loans
B) Conventional Home Purchase Loans
C) Refinancings
D) Home Improvement Loans
F) Non-occupant Loans on < 5 Family Dwellings (A B C & D)
G) Loans On Manufactured Home Dwelling (A B C & D)
Number
Average Value
Number
Average Value
Number
Average Value
Number
Average Value
Number
Average Value
Number
Average Value
LOANS ORIGINATED
2
$109,915
18
$71,853
28
$80,338
11
$43,187
3
$93,260
7
$74,277
APPLICATIONS APPROVED, NOT ACCEPTED
0
$0
2
$109,740
9
$79,002
1
$29,450
0
$0
2
$78,185
APPLICATIONS DENIED
0
$0
4
$66,615
36
$92,237
7
$38,917
1
$55,390
4
$85,460
APPLICATIONS WITHDRAWN
0
$0
1
$111,140
11
$98,678
0
$0
0
$0
1
$152,160
FILES CLOSED FOR INCOMPLETENESS
0
$0
1
$42,420
2
$120,955
1
$58,900
0
$0
0
$0
Aggregated Statistics For Year 2006 (Based on 2 partial tracts)
A) FHA, FSA/RHS & VA Home Purchase Loans
B) Conventional Home Purchase Loans
C) Refinancings
D) Home Improvement Loans
F) Non-occupant Loans on < 5 Family Dwellings (A B C & D)
G) Loans On Manufactured Home Dwelling (A B C & D)
Number
Average Value
Number
Average Value
Number
Average Value
Number
Average Value
Number
Average Value
Number
Average Value
LOANS ORIGINATED
4
$73,275
12
$78,388
28
$83,205
13
$33,442
2
$42,425
2
$88,000
APPLICATIONS APPROVED, NOT ACCEPTED
0
$0
3
$44,643
6
$90,222
1
$32,960
0
$0
0
$0
APPLICATIONS DENIED
0
$0
6
$63,400
36
$83,521
5
$28,258
1
$75,380
5
$75,660
APPLICATIONS WITHDRAWN
1
$49,430
1
$9,120
13
$92,612
1
$46,980
1
$26,650
0
$0
FILES CLOSED FOR INCOMPLETENESS
0
$0
0
$0
4
$95,625
0
$0
0
$0
0
$0
Aggregated Statistics For Year 2005 (Based on 2 partial tracts)
B) Conventional Home Purchase Loans
C) Refinancings
D) Home Improvement Loans
F) Non-occupant Loans on < 5 Family Dwellings (A B C & D)
G) Loans On Manufactured Home Dwelling (A B C & D)
Number
Average Value
Number
Average Value
Number
Average Value
Number
Average Value
Number
Average Value
LOANS ORIGINATED
10
$76,676
36
$74,600
14
$41,972
3
$68,250
4
$57,322
APPLICATIONS APPROVED, NOT ACCEPTED
2
$63,985
8
$69,506
3
$47,330
1
$31,200
0
$0
APPLICATIONS DENIED
7
$66,213
45
$75,083
7
$35,360
2
$28,225
6
$58,783
APPLICATIONS WITHDRAWN
2
$85,895
21
$96,816
2
$119,730
0
$0
1
$101,320
FILES CLOSED FOR INCOMPLETENESS
1
$55,390
4
$83,530
0
$0
0
$0
0
$0
Aggregated Statistics For Year 2004 (Based on 2 partial tracts)
A) FHA, FSA/RHS & VA Home Purchase Loans
B) Conventional Home Purchase Loans
C) Refinancings
D) Home Improvement Loans
F) Non-occupant Loans on < 5 Family Dwellings (A B C & D)
G) Loans On Manufactured Home Dwelling (A B C & D)
Number
Average Value
Number
Average Value
Number
Average Value
Number
Average Value
Number
Average Value
Number
Average Value
LOANS ORIGINATED
0
$0
19
$79,291
38
$69,437
13
$38,620
5
$49,856
1
$80,990
APPLICATIONS APPROVED, NOT ACCEPTED
0
$0
3
$57,147
8
$67,052
2
$68,895
1
$55,040
2
$32,780
APPLICATIONS DENIED
1
$43,830
4
$79,498
39
$80,341
10
$31,659
3
$63,927
4
$71,085
APPLICATIONS WITHDRAWN
0
$0
5
$95,784
21
$82,975
2
$36,110
1
$50,840
1
$98,520
FILES CLOSED FOR INCOMPLETENESS
0
$0
2
$84,145
12
$96,093
0
$0
1
$56,800
0
$0
Aggregated Statistics For Year 2003 (Based on 2 partial tracts)
A) FHA, FSA/RHS & VA Home Purchase Loans
B) Conventional Home Purchase Loans
C) Refinancings
D) Home Improvement Loans
F) Non-occupant Loans on < 5 Family Dwellings (A B C & D)
Number
Average Value
Number
Average Value
Number
Average Value
Number
Average Value
Number
Average Value
LOANS ORIGINATED
1
$70,120
16
$90,214
61
$77,379
11
$27,538
2
$72,925
APPLICATIONS APPROVED, NOT ACCEPTED
0
$0
2
$52,065
12
$81,602
3
$17,997
1
$24,190
APPLICATIONS DENIED
0
$0
5
$67,034
61
$78,937
11
$21,195
2
$35,410
APPLICATIONS WITHDRAWN
0
$0
3
$87,183
22
$81,132
1
$5,610
1
$83,440
FILES CLOSED FOR INCOMPLETENESS
0
$0
0
$0
4
$69,068
0
$0
0
$0
Aggregated Statistics For Year 2002 (Based on 2 partial tracts)
A) FHA, FSA/RHS & VA Home Purchase Loans
B) Conventional Home Purchase Loans
C) Refinancings
D) Home Improvement Loans
F) Non-occupant Loans on < 5 Family Dwellings (A B C & D)
Number
Average Value
Number
Average Value
Number
Average Value
Number
Average Value
Number
Average Value
LOANS ORIGINATED
1
$110,090
17
$75,462
47
$67,994
10
$24,822
2
$83,445
APPLICATIONS APPROVED, NOT ACCEPTED
0
$0
2
$68,540
17
$65,438
3
$27,230
0
$0
APPLICATIONS DENIED
0
$0
10
$42,002
34
$71,904
5
$9,186
1
$65,560
APPLICATIONS WITHDRAWN
1
$83,790
1
$58,900
25
$77,146
1
$16,830
0
$0
FILES CLOSED FOR INCOMPLETENESS
0
$0
1
$62,410
9
$76,587
0
$0
0
$0
Aggregated Statistics For Year 2001 (Based on 2 partial tracts)
A) FHA, FSA/RHS & VA Home Purchase Loans
B) Conventional Home Purchase Loans
C) Refinancings
D) Home Improvement Loans
F) Non-occupant Loans on < 5 Family Dwellings (A B C & D)
Number
Average Value
Number
Average Value
Number
Average Value
Number
Average Value
Number
Average Value
LOANS ORIGINATED
2
$73,625
15
$59,439
44
$60,941
13
$22,168
2
$28,400
APPLICATIONS APPROVED, NOT ACCEPTED
0
$0
6
$43,767
21
$65,980
6
$28,750
0
$0
APPLICATIONS DENIED
0
$0
11
$47,745
60
$60,192
12
$18,261
1
$31,550
APPLICATIONS WITHDRAWN
0
$0
2
$33,480
26
$69,513
4
$15,602
1
$30,850
FILES CLOSED FOR INCOMPLETENESS
0
$0
1
$24,540
4
$68,892
0
$0
0
$0
Aggregated Statistics For Year 2000 (Based on 2 partial tracts)
A) FHA, FSA/RHS & VA Home Purchase Loans
B) Conventional Home Purchase Loans
C) Refinancings
D) Home Improvement Loans
F) Non-occupant Loans on < 5 Family Dwellings (A B C & D)
Number
Average Value
Number
Average Value
Number
Average Value
Number
Average Value
Number
Average Value
LOANS ORIGINATED
4
$47,330
22
$50,757
28
$52,102
13
$19,148
1
$25,240
APPLICATIONS APPROVED, NOT ACCEPTED
0
$0
6
$45,578
16
$69,244
4
$26,732
0
$0
APPLICATIONS DENIED
2
$35,585
24
$48,836
33
$53,408
13
$14,725
1
$50,140
APPLICATIONS WITHDRAWN
1
$38,920
3
$51,303
13
$54,936
1
$17,180
0
$0
FILES CLOSED FOR INCOMPLETENESS
0
$0
1
$80,990
4
$56,535
0
$0
0
$0
Aggregated Statistics For Year 1999 (Based on 1 partial tract)
A) FHA, FSA/RHS & VA Home Purchase Loans
B) Conventional Home Purchase Loans
C) Refinancings
D) Home Improvement Loans
F) Non-occupant Loans on < 5 Family Dwellings (A B C & D)


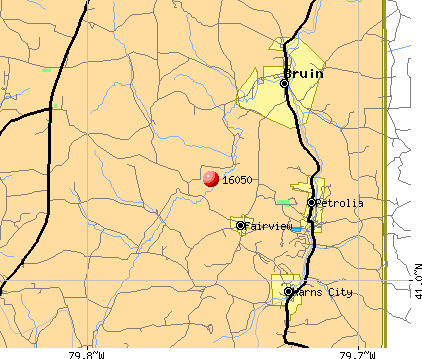 Nearest zip codes: 16022, 16048, 16041, 16040, 16030, 16049.