Estimated zip code population in 2022: 2,226 Zip code population in 2010: 2,537 Zip code population in 2000: 2,315
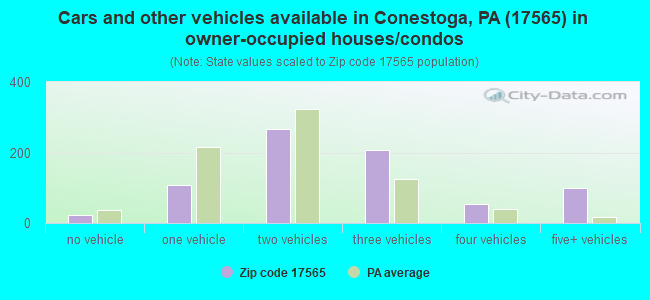
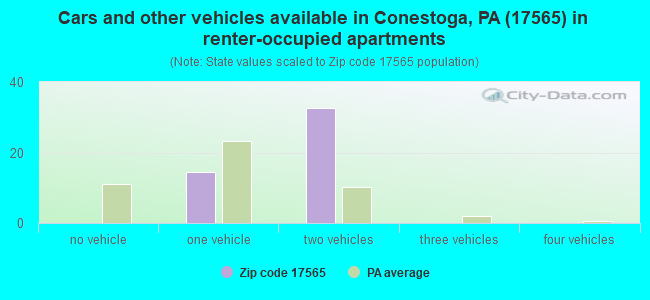
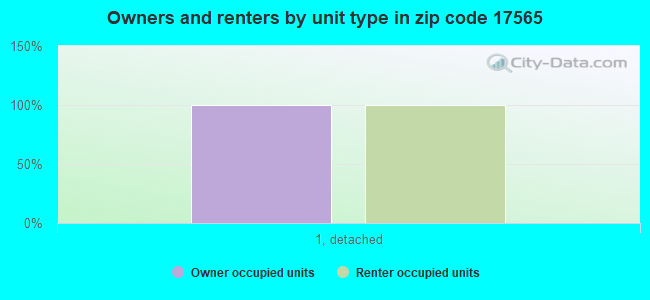
Houses and condos: 889 Renter-occupied apartments: 47
% of renters here:
6%
State:
31%
March 2022 cost of living index in zip code 17565: 93.4 (less than average, U.S. average is 100)
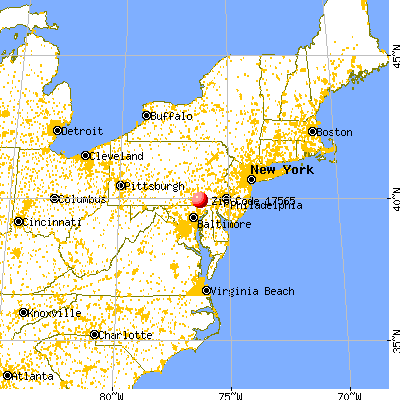
Land area: 13.8 sq. mi. Water area: 2.7 sq. mi.
Population density: 162 people per square mile
(very low).
OSM Map
General Map
Google Map
MSN Map
OSM Map
General Map
Google Map
MSN Map
OSM Map
General Map
Google Map
MSN Map
OSM Map
General Map
Google Map
MSN Map
Please wait while loading the map...
Real estate property taxes paid for housing units in 2022:
This zip code:
1.1% ($3,629)
Pennsylvania:
1.3% ($3,094)
Median real estate property taxes paid for housing units with mortgages in 2022: $3,701 (1.2%) Median real estate property taxes paid for housing units with no mortgage in 2022: $3,535 (1.0%)
Business Search- 14 Million verified businesses
Males: 1,165
(52.3%)
Females: 1,060
(47.7%)
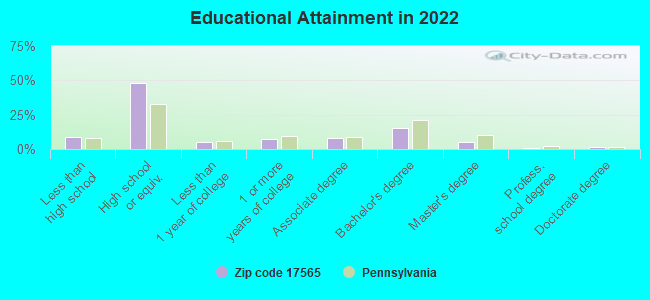
For population 25 years and over in 17565:
High school or higher: 90.4%
Bachelor's degree or higher: 22.8%
Graduate or professional degree: 7.6%
Unemployed: 0.5%
Mean travel time to work (commute): 27.6 minutes
For population 15 years and over in 17565:
Never married: 20.2%
Now married: 68.8%
Separated: 0.0%
Widowed: 4.4%
Divorced: 6.6%
Zip code 17565 compared to state average:
Unemployed percentage significantly below state average.
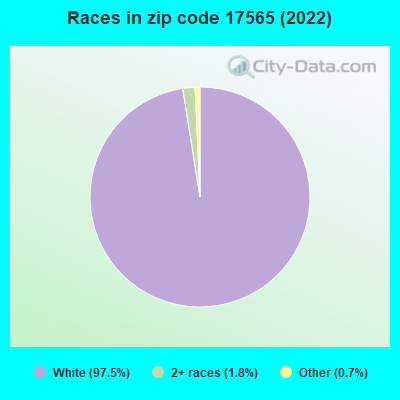
Black race population percentage significantly below state average.
Hispanic race population percentage significantly below state average.
Median age above state average.
Foreign-born population percentage significantly below state average.
Renting percentage significantly below state average.
Length of stay since moving in significantly above state average.
Number of college students significantly below state average.
Percentage of population with a bachelor's degree or higher below state average.
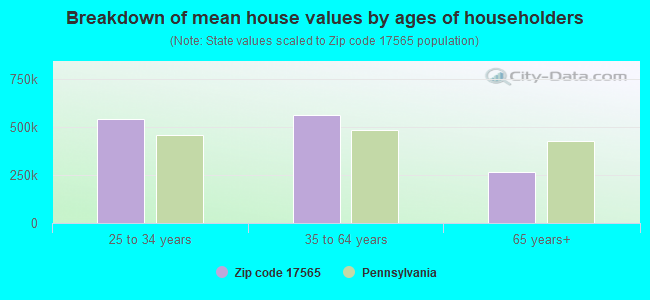
Estimated median house/condo value in 2022: $316,155
17565:
$316,155
Pennsylvania:
$245,500
According to our research of Pennsylvania and other state lists, there were 2 registered sex offenders living in 17565 zip code as of June 15, 2024. The ratio of all residents to sex offenders in zip code 17565 is 1,414 to 1. The ratio of registered sex offenders to all residents in this zip code is lower than the state average.
Median resident age:
This zip code:
46.5 years
Pennsylvania median age:
40.9 years
Average household size:
This zip code:
2.7 people
Pennsylvania:
2.4 people
Averages for the 2020 tax year for zip code 17565, filed in 2021:
Average Adjusted Gross Income (AGI) in 2020: $73,683 (Individual Income Tax Returns)
Here:
$73,683
State:
$75,707
Salary/wage: $63,428 (reported on 80.3% of returns)
Here:
$63,428
State:
$62,806
(% of AGI for various income ranges: 997.7% for AGIs below $25k, 3372.3% for AGIs $25k-50k, 6608.8% for AGIs $50k-75k, 9256.4% for AGIs $75k-100k, 15196.2% for AGIs $100k-200k)
Taxable interest for individuals: $1,009 (reported on 34.1% of returns)
This zip code:
$1,009
Pennsylvania:
$1,633
(% of AGI for various income ranges: 27.7% for AGIs below $25k, 9.1% for AGIs $25k-50k, 30.0% for AGIs $50k-75k, 60.9% for AGIs $75k-100k, 63.1% for AGIs $100k-200k)
Ordinary dividends: $4,032 (reported on 25.8% of returns)
Here:
$4,032
State:
$7,382
(% of AGI for various income ranges: 60.9% for AGIs below $25k, 74.5% for AGIs $25k-50k, 71.9% for AGIs $50k-75k, 321.8% for AGIs $75k-100k, 210.0% for AGIs $100k-200k)
Net capital gain/loss in AGI: +$12,332 (reported on 21.2% of returns)
Here:
+$12,332
State:
+$23,522
(% of AGI for various income ranges: 10.0% for AGIs below $25k, 67.7% for AGIs $25k-50k, 71.2% for AGIs $50k-75k, 250.0% for AGIs $75k-100k, 363.8% for AGIs $100k-200k)
Profit/loss from business: +$16,138 (reported on 15.9% of returns)
Here:
+$16,138
State:
+$16,274
(% of AGI for various income ranges: 198.2% for AGIs below $25k, 288.2% for AGIs $25k-50k, 206.2% for AGIs $50k-75k, 381.8% for AGIs $75k-100k, 980.6% for AGIs $100k-200k)
Taxable individual retirement arrangement distribution: $16,659 (reported on 12.9% of returns)
17565:
$16,659
Pennsylvania:
$18,583
(% of AGI for various income ranges: 113.6% for AGIs below $25k, 266.8% for AGIs $25k-50k, 410.9% for AGIs $75k-100k, 964.4% for AGIs $100k-200k)
Total itemized deductions: $35,775 (reported on 9.1% of returns)
Here:
$35,775
State:
$34,850
(% of AGI for various income ranges: 323.2% for AGIs $25k-50k, 595.5% for AGIs $75k-100k, 705.6% for AGIs $100k-200k)
Charity contributions: $11,311 (reported on 6.8% of returns)
Here:
$11,311
State:
$12,392
(% of AGI for various income ranges: 85.0% for AGIs $50k-75k, 112.5% for AGIs $100k-200k)
Taxes paid: $8,000 (reported on 9.1% of returns)
17565:
$8,000
State:
$8,200
(% of AGI for various income ranges: 88.2% for AGIs $25k-50k, 181.8% for AGIs $75k-100k, 176.2% for AGIs $100k-200k)
Earned income credit: $2,064 (reported on 8.3% of returns)
Here:
$2,064
State:
$2,100
(% of AGI for various income ranges: 52.3% for AGIs below $25k, 50.9% for AGIs $25k-50k)
Percentage of individuals using paid preparers for their 2020 taxes: 93.9%
Here:
94%
State:
92%
(% for various income ranges: 91.4% for AGIs below $25k, 93.3% for AGIs $25k-50k, 95.5% for AGIs $50k-75k, 93.8% for AGIs $75k-100k, 95.7% for AGIs $100k-200k, 100.0% for AGIs over 200k)
Averages for the 2012 tax year for zip code 17565, filed in 2013:
Average Adjusted Gross Income (AGI) in 2012: $56,105 (Individual Income Tax Returns)
Here:
$56,105
State:
$61,346
Salary/wage: $49,369 (reported on 84.7% of returns)
Here:
$49,369
State:
$51,902
(% of AGI for various income ranges: 69.8% for AGIs below $25k, 80.8% for AGIs $25k-50k, 81.1% for AGIs $50k-75k, 82.5% for AGIs $75k-100k, 78.6% for AGIs $100k-200k, 44.7% for AGIs over 200k)
Taxable interest for individuals: $957 (reported on 35.1% of returns)
This zip code:
$957
Pennsylvania:
$1,588
(% of AGI for various income ranges: 1.4% for AGIs below $25k, 0.4% for AGIs $25k-50k, 0.5% for AGIs $50k-75k, 0.1% for AGIs $75k-100k, 0.2% for AGIs $100k-200k, 2.0% for AGIs over 200k)
Ordinary dividends: $1,918 (reported on 25.2% of returns)
Here:
$1,918
State:
$5,827
(% of AGI for various income ranges: 2.5% for AGIs below $25k, 0.9% for AGIs $25k-50k, 0.5% for AGIs $50k-75k, 0.5% for AGIs $75k-100k, 1.3% for AGIs $100k-200k)
Net capital gain/loss in AGI: +$6,867 (reported on 16.0% of returns)
Here:
+$6,867
State:
+$14,495
(% of AGI for various income ranges: 0.4% for AGIs $50k-75k, 6.4% for AGIs $100k-200k)
Profit/loss from business: +$12,152 (reported on 16.0% of returns)
Here:
+$12,152
State:
+$16,268
(% of AGI for various income ranges: 11.6% for AGIs below $25k, 5.8% for AGIs $25k-50k, 2.8% for AGIs $50k-75k, 5.8% for AGIs $75k-100k, 0.9% for AGIs $100k-200k)
Taxable individual retirement arrangement distribution: $13,131 (reported on 9.9% of returns)
17565:
$13,131
Pennsylvania:
$14,550
(% of AGI for various income ranges: 3.7% for AGIs below $25k, 2.1% for AGIs $25k-50k, 4.4% for AGIs $50k-75k, 3.6% for AGIs $100k-200k)
Total itemized deductions: $20,343 (20% of AGI, reported on 35.9% of returns)
Here:
$20,343
State:
$23,538
Here:
20.2% of AGI
State:
18.4% of AGI
(% of AGI for various income ranges: 9.8% for AGIs below $25k, 10.9% for AGIs $25k-50k, 14.2% for AGIs $50k-75k, 13.4% for AGIs $75k-100k, 15.3% for AGIs $100k-200k, 10.0% for AGIs over 200k)
Charity contributions: $3,383 (reported on 26.7% of returns)
Here:
$3,383
State:
$4,025
(% of AGI for various income ranges: 1.3% for AGIs $25k-50k, 1.9% for AGIs $50k-75k, 1.6% for AGIs $75k-100k, 2.0% for AGIs $100k-200k, 1.8% for AGIs over 200k)
Taxes paid: $7,902 (reported on 35.9% of returns)
17565:
$7,902
State:
$9,982
(% of AGI for various income ranges: 2.2% for AGIs below $25k, 2.9% for AGIs $25k-50k, 4.9% for AGIs $50k-75k, 5.3% for AGIs $75k-100k, 6.6% for AGIs $100k-200k, 5.1% for AGIs over 200k)
Earned income credit: $1,860 (reported on 11.5% of returns)
Here:
$1,860
State:
$2,106
(% of AGI for various income ranges: 3.6% for AGIs below $25k, 0.8% for AGIs $25k-50k)
Percentage of individuals using paid preparers for their 2012 taxes: 57.3%
Here:
57%
State:
53%
(% for various income ranges: 49.0% for AGIs below $25k, 55.6% for AGIs $25k-50k, 68.4% for AGIs $50k-75k, 62.5% for AGIs $75k-100k, 64.7% for AGIs $100k-200k, 66.7% for AGIs over 200k)
Averages for the 2004 tax year for zip code 17565, filed in 2005:
Average Adjusted Gross Income (AGI) in 2004: $46,433 (Individual Income Tax Returns)
Here:
$46,433
State:
$48,049
Salary/wage: $44,383 (reported on 87.7% of returns)
Here:
$44,383
State:
$42,646
(% of AGI for various income ranges: 98.9% for AGIs below $10k, 74.0% for AGIs $10k-25k, 85.3% for AGIs $25k-50k, 85.7% for AGIs $50k-75k, 88.3% for AGIs $75k-100k, 79.6% for AGIs over 100k)
Taxable interest for individuals: $706 (reported on 51.1% of returns)
This zip code:
$706
Pennsylvania:
$1,657
(% of AGI for various income ranges: 4.8% for AGIs below $10k, 3.0% for AGIs $10k-25k, 0.7% for AGIs $25k-50k, 0.8% for AGIs $50k-75k, 0.4% for AGIs $75k-100k, 0.4% for AGIs over 100k)
Taxable dividends: $1,276 (reported on 27.1% of returns)
Here:
$1,276
State:
$3,566
(% of AGI for various income ranges: 2.8% for AGIs below $10k, 1.9% for AGIs $10k-25k, 0.3% for AGIs $25k-50k, 0.6% for AGIs $50k-75k, 0.3% for AGIs $75k-100k, 1.1% for AGIs over 100k)
Net capital gain/loss: +$5,502 (reported on 19.3% of returns)
Here:
+$5,502
State:
+$9,716
(% of AGI for various income ranges: 5.6% for AGIs below $10k, 2.8% for AGIs $10k-25k, 0.5% for AGIs $25k-50k, 0.5% for AGIs $50k-75k, 1.6% for AGIs $75k-100k, 5.1% for AGIs over 100k)
Profit/loss from business: +$11,054 (reported on 16.0% of returns)
Here:
+$11,054
State:
+$14,267
(% of AGI for various income ranges: 9.4% for AGIs below $10k, 8.2% for AGIs $10k-25k, 7.6% for AGIs $25k-50k, 4.3% for AGIs $50k-75k, 2.8% for AGIs $75k-100k, 0.3% for AGIs over 100k)
Profit/loss from farming: +$6,870 (reported on 1.8% of returns)
Here:
+$6,870
State:
+$274
IRA payment deduction: $2,791 (reported on 3.4% of returns)
17565:
$2,791
Pennsylvania:
$2,903
Total itemized deductions: $17,117 (22% of AGI, reported on 38.1% of returns)
Here:
$17,117
State:
$18,804
Here:
21.8% of AGI
State:
19.5% of AGI
(% of AGI for various income ranges: 10.8% for AGIs below $10k, 10.3% for AGIs $10k-25k, 11.6% for AGIs $25k-50k, 14.5% for AGIs $50k-75k, 15.8% for AGIs $75k-100k, 15.2% for AGIs over 100k)
Charity contributions deductions: $2,555 (3% of AGI, reported on 31.9% of returns)
Here:
$2,555
State:
$3,337
Here:
3.0% of AGI
State:
3.3% of AGI
(% of AGI for various income ranges: 2.0% for AGIs $10k-25k, 1.0% for AGIs $25k-50k, 1.7% for AGIs $50k-75k, 1.7% for AGIs $75k-100k, 2.4% for AGIs over 100k)
Total tax: $6,319 (reported on 78.2% of returns)
17565:
$6,319
State:
$8,008
(% of AGI for various income ranges: 3.1% for AGIs below $10k, 5.0% for AGIs $10k-25k, 7.9% for AGIs $25k-50k, 8.6% for AGIs $50k-75k, 9.9% for AGIs $75k-100k, 16.4% for AGIs over 100k)
Earned income credit: $1,337 (reported on 7.5% of returns)
Here:
$1,337
State:
$1,643
Percentage of individuals using paid preparers for their 2004 taxes: 58.9%
Here:
59%
State:
56%
(% for various income ranges: 51.7% for AGIs below $10k, 63.3% for AGIs $10k-25k, 59.4% for AGIs $25k-50k, 55.5% for AGIs $50k-75k, 61.9% for AGIs $75k-100k, 69.7% for AGIs over 100k)
Household received Food Stamps/SNAP in the past 12 months: 45 Household did not receive Food Stamps/SNAP in the past 12 months: 760
Women who had a birth in the past 12 months: 13 (14 now married, 0 unmarried) Women who did not have a birth in the past 12 months: 284 (115 now married, 168 unmarried)
Housing units in zip code 17565 with a mortgage: 431 (62 second mortgage, 62 both second mortgage and home equity loan) Houses without a mortgage: 45
Median monthly owner costs for units with a mortgage: $1,902 Median monthly owner costs for units without a mortgage: $622
Residents with income below the poverty level in 2022:
This zip code:
6.2%
Whole state:
11.8%
Residents with income below 50% of the poverty level in 2022:
This zip code:
5.2%
Whole state:
6.1%
Median number of rooms in houses and condos:
Here:
7.0
State:
6.8
Median number of rooms in apartments:
Here:
5.8
State:
4.3
Notable locations in this zip code not listed on our city pages
Streams, rivers, and creeks: Pequea Creek (A), Trout Run (B), House Rock Run (C), Climbers Run (D), Martock Run (E), Brubaker Run (F), Reed Run (G). Display/hide their locations on the map
Size of family households: 363 2-persons, 195 3-persons, 83 4-persons, 17 5-persons, 14 6-persons, 38 7-or-more-persons
Size of nonfamily households: 69 1-person, 23 2-persons
401 married couples with children.
157 single-parent households (105 men, 52 women).
87.1% of residents of 17565 zip code speak English at home.
12.4% of residents speak other Indo-European language at home (81% very well, 13% well, 6% not well).
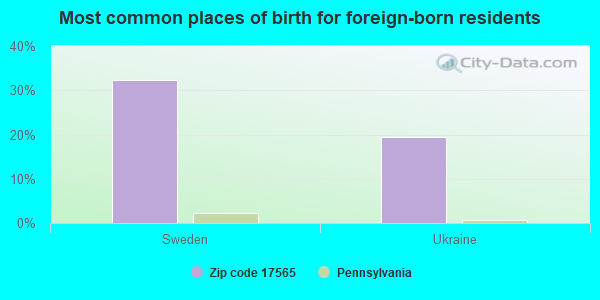
Foreign born population: 31 (1.4%) (100.0% of them are naturalized citizens)
This zip code:
1.4%
Whole state:
7.5%
32%Sweden
19%Ukraine
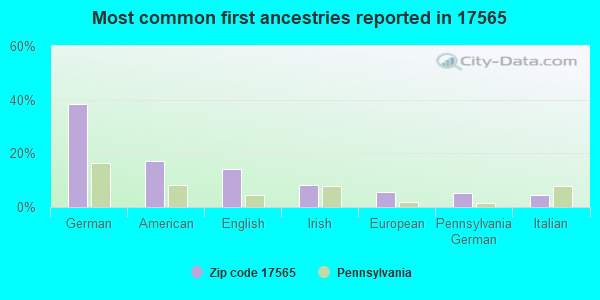
38%German
17%American
14%English
8%Irish
6%European
5%Pennsylvania German
4%Italian
Year of entry for the foreign-born population
02010 or later
02000 to 2009
01990 to 1999
27Before 1990
Public elementary/middle school in in zip code 17565 not listed on the city page:
Housing units lacking complete plumbing facilities: 8.4% Housing units lacking complete kitchen facilities: 7.5%
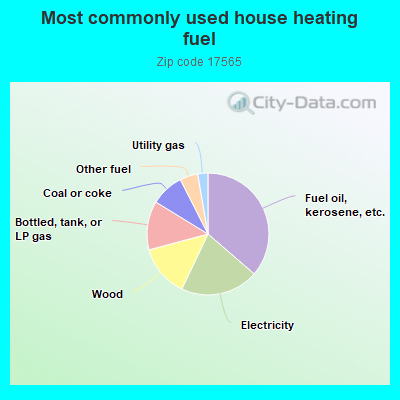
36.5%Fuel oil, kerosene, etc.
20.8%Electricity
13.8%Wood
13.0%Bottled, tank, or LP gas
8.8%Coal or coke
4.8%Other fuel
2.7%Utility gas
Population in 1990: 1,800. Population change in the 1990s: +515 (+28.6%).
Place of birth for U.S.-born residents:
This state: 1,902
Northeast: 71
Midwest: 32
South: 149
West: 25
70% of the 17565 zip code residents lived in the same house 5 years ago. Out of people who lived in different houses, 78% lived in this county. Out of people who lived in different counties, 50% lived in Pennsylvania.
100% of the 17565 zip code residents lived in the same house 1 year ago. Out of people who lived in different houses, 200% moved from different county within same state.
Private vs. public school enrollment:
Students in private schools in grades 1 to 8 (elementary and middle school): 106
Here:
35.3%
Pennsylvania:
15.7%
Students in private schools in grades 9 to 12 (high school): 9
Here:
18.1%
Pennsylvania:
13.4%
Students in private undergraduate colleges:
Here:
0.0%
Pennsylvania:
39.8%
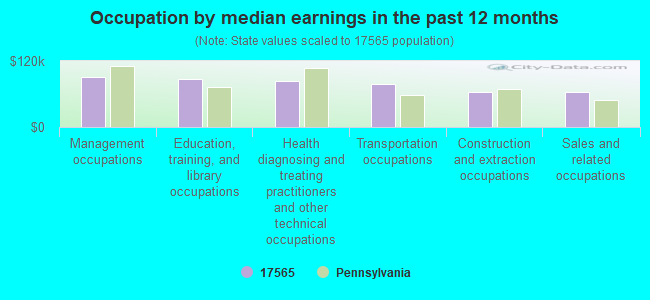
Occupation by median earnings in the past 12 months ($)
91,780Management occupations
87,518Education, training, and library occupations
84,039Health diagnosing and treating practitioners and other technical occupations
77,657Transportation occupations
63,782Construction and extraction occupations
63,011Sales and related occupations
Top industries in this zip code by the number of employees in 2005:
Accommodation and Food Services: Limited-Service Restaurants (20-49 employees: 2 establishments)
Health Care and Social Assistance: Other Residential Care Facilities (10-19: 1)
Health Care and Social Assistance: Child Day Care Services (10-19: 1)
Construction: Site Preparation Contractors (10-19: 1)
Construction: Plumbing, Heating, and Air-Conditioning Contractors (5-9: 2)
Construction: Electrical Contractors (5-9: 1)
Other Services (except Public Administration): Religious Organizations (5-9: 1)
Construction: Poured Concrete Foundation and Structure Contractors (5-9: 1)
Wholesale Trade: Wholesale Trade Agents and Brokers (1-4: 2)
Construction: Residential Remodelers (1-4: 2)
People in group quarters in 2000:
27 people in other noninstitutional group quarters
Fatal accident statistics in 2014:
Fatal accident count: 1
Vehicles involved in fatal accidents: 1
Fatal accidents caused by drunken drivers: 0
Fatalities: 1
Persons involved in fatal accidents: 1
Pedestrians involved in fatal accidents: 0
Fatal accident statistics in 2010:
Fatal accident count: 1
Vehicles involved in fatal accidents: 1
Fatal accidents caused by drunken drivers: 1
Fatalities: 2
Persons involved in fatal accidents: 2
Pedestrians involved in fatal accidents: 0
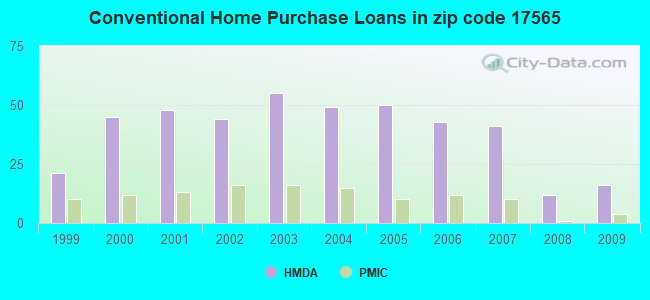
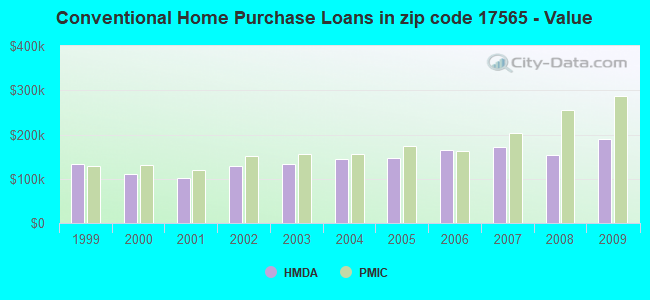
Home Mortgage Disclosure Act Aggregated Statistics For Year 2009 (Based on 2 partial tracts)
A) FHA, FSA/RHS & VA Home Purchase Loans
B) Conventional Home Purchase Loans
C) Refinancings
D) Home Improvement Loans
F) Non-occupant Loans on < 5 Family Dwellings (A B C & D)
G) Loans On Manufactured Home Dwelling (A B C & D)
Number
Average Value
Number
Average Value
Number
Average Value
Number
Average Value
Number
Average Value
Number
Average Value
LOANS ORIGINATED
14
$189,816
16
$189,328
99
$163,259
19
$93,838
4
$150,770
2
$135,365
APPLICATIONS APPROVED, NOT ACCEPTED
1
$173,790
1
$159,250
10
$171,092
1
$3,460
0
$0
1
$25,620
APPLICATIONS DENIED
1
$285,270
3
$181,177
42
$173,611
9
$44,468
3
$71,780
2
$57,125
APPLICATIONS WITHDRAWN
3
$156,250
2
$220,185
21
$184,706
2
$92,435
1
$6,920
1
$29,080
FILES CLOSED FOR INCOMPLETENESS
1
$109,400
1
$27,000
3
$191,103
1
$242,340
1
$129,480
1
$27,000
Aggregated Statistics For Year 2008 (Based on 2 partial tracts)
A) FHA, FSA/RHS & VA Home Purchase Loans
B) Conventional Home Purchase Loans
C) Refinancings
D) Home Improvement Loans
F) Non-occupant Loans on < 5 Family Dwellings (A B C & D)
G) Loans On Manufactured Home Dwelling (A B C & D)
Number
Average Value
Number
Average Value
Number
Average Value
Number
Average Value
Number
Average Value
Number
Average Value
LOANS ORIGINATED
10
$173,585
12
$153,712
69
$138,470
26
$50,279
5
$145,958
4
$122,208
APPLICATIONS APPROVED, NOT ACCEPTED
1
$129,480
1
$153,710
10
$172,685
4
$63,182
1
$303,270
1
$132,940
APPLICATIONS DENIED
4
$159,772
4
$112,515
29
$148,484
16
$56,820
1
$173,100
2
$49,160
APPLICATIONS WITHDRAWN
0
$0
3
$210,720
16
$176,346
1
$20,770
0
$0
1
$191,790
FILES CLOSED FOR INCOMPLETENESS
1
$90,010
1
$265,880
6
$143,673
2
$77,205
1
$155,100
0
$0
Aggregated Statistics For Year 2007 (Based on 2 partial tracts)
A) FHA, FSA/RHS & VA Home Purchase Loans
B) Conventional Home Purchase Loans
C) Refinancings
D) Home Improvement Loans
F) Non-occupant Loans on < 5 Family Dwellings (A B C & D)
G) Loans On Manufactured Home Dwelling (A B C & D)
Number
Average Value
Number
Average Value
Number
Average Value
Number
Average Value
Number
Average Value
Number
Average Value
LOANS ORIGINATED
4
$207,200
41
$171,833
79
$122,213
34
$41,096
4
$179,678
6
$87,935
APPLICATIONS APPROVED, NOT ACCEPTED
1
$175,870
5
$130,172
10
$119,508
3
$71,087
0
$0
1
$51,240
APPLICATIONS DENIED
0
$0
3
$175,177
42
$177,518
15
$89,689
2
$265,190
2
$57,125
APPLICATIONS WITHDRAWN
0
$0
3
$121,170
17
$159,456
1
$15,230
0
$0
0
$0
FILES CLOSED FOR INCOMPLETENESS
1
$61,620
3
$142,403
3
$197,333
0
$0
0
$0
1
$27,000
Aggregated Statistics For Year 2006 (Based on 2 partial tracts)
A) FHA, FSA/RHS & VA Home Purchase Loans
B) Conventional Home Purchase Loans
C) Refinancings
D) Home Improvement Loans
F) Non-occupant Loans on < 5 Family Dwellings (A B C & D)
G) Loans On Manufactured Home Dwelling (A B C & D)
Number
Average Value
Number
Average Value
Number
Average Value
Number
Average Value
Number
Average Value
Number
Average Value
LOANS ORIGINATED
3
$164,560
43
$165,934
88
$110,949
37
$39,729
5
$183,902
6
$43,275
APPLICATIONS APPROVED, NOT ACCEPTED
0
$0
4
$76,682
17
$119,419
3
$120,017
0
$0
1
$29,080
APPLICATIONS DENIED
1
$70,620
6
$183,255
59
$133,727
19
$70,515
0
$0
4
$99,012
APPLICATIONS WITHDRAWN
0
$0
6
$129,478
46
$145,675
2
$34,965
1
$122,550
0
$0
FILES CLOSED FOR INCOMPLETENESS
0
$0
2
$119,785
10
$136,334
1
$35,310
0
$0
0
$0
Aggregated Statistics For Year 2005 (Based on 2 partial tracts)
A) FHA, FSA/RHS & VA Home Purchase Loans
B) Conventional Home Purchase Loans
C) Refinancings
D) Home Improvement Loans
F) Non-occupant Loans on < 5 Family Dwellings (A B C & D)
G) Loans On Manufactured Home Dwelling (A B C & D)
Number
Average Value
Number
Average Value
Number
Average Value
Number
Average Value
Number
Average Value
Number
Average Value
LOANS ORIGINATED
4
$145,058
50
$147,024
116
$124,543
42
$48,072
4
$211,355
4
$53,142
APPLICATIONS APPROVED, NOT ACCEPTED
0
$0
6
$217,645
25
$123,524
5
$89,736
1
$207,720
0
$0
APPLICATIONS DENIED
0
$0
12
$126,709
81
$150,618
13
$45,272
2
$103,170
3
$50,777
APPLICATIONS WITHDRAWN
0
$0
3
$148,403
66
$164,267
4
$70,625
1
$82,400
1
$88,630
FILES CLOSED FOR INCOMPLETENESS
0
$0
3
$218,337
7
$138,677
1
$69,240
0
$0
0
$0
Aggregated Statistics For Year 2004 (Based on 2 partial tracts)
A) FHA, FSA/RHS & VA Home Purchase Loans
B) Conventional Home Purchase Loans
C) Refinancings
D) Home Improvement Loans
F) Non-occupant Loans on < 5 Family Dwellings (A B C & D)
G) Loans On Manufactured Home Dwelling (A B C & D)
Number
Average Value
Number
Average Value
Number
Average Value
Number
Average Value
Number
Average Value
Number
Average Value
LOANS ORIGINATED
1
$150,940
49
$145,305
127
$111,198
30
$36,305
9
$113,169
4
$46,218
APPLICATIONS APPROVED, NOT ACCEPTED
0
$0
7
$124,039
21
$110,850
6
$52,853
0
$0
1
$6,920
APPLICATIONS DENIED
1
$46,390
12
$104,264
55
$111,099
13
$30,146
1
$6,230
11
$68,233
APPLICATIONS WITHDRAWN
0
$0
3
$137,097
44
$136,544
1
$10,390
1
$108,010
0
$0
FILES CLOSED FOR INCOMPLETENESS
0
$0
3
$100,860
9
$148,250
1
$34,620
1
$62,320
0
$0
Aggregated Statistics For Year 2003 (Based on 2 partial tracts)
A) FHA, FSA/RHS & VA Home Purchase Loans
B) Conventional Home Purchase Loans
C) Refinancings
D) Home Improvement Loans
E) Loans on Dwellings For 5+ Families
F) Non-occupant Loans on < 5 Family Dwellings (A B C & D)
Number
Average Value
Number
Average Value
Number
Average Value
Number
Average Value
Number
Average Value
Number
Average Value
LOANS ORIGINATED
3
$153,020
55
$132,576
224
$112,391
26
$20,532
1
$69,240
6
$61,970
APPLICATIONS APPROVED, NOT ACCEPTED
0
$0
5
$116,324
31
$113,464
3
$61,393
0
$0
1
$41,540
APPLICATIONS DENIED
2
$64,045
8
$68,201
65
$111,444
10
$37,320
0
$0
0
$0
APPLICATIONS WITHDRAWN
1
$87,240
6
$105,130
47
$146,185
2
$39,465
0
$0
1
$223,650
FILES CLOSED FOR INCOMPLETENESS
0
$0
1
$162,020
4
$147,480
1
$10,390
0
$0
0
$0
Aggregated Statistics For Year 2002 (Based on 2 partial tracts)
A) FHA, FSA/RHS & VA Home Purchase Loans
B) Conventional Home Purchase Loans
C) Refinancings
D) Home Improvement Loans
F) Non-occupant Loans on < 5 Family Dwellings (A B C & D)
Number
Average Value
Number
Average Value
Number
Average Value
Number
Average Value
Number
Average Value
LOANS ORIGINATED
12
$113,784
44
$128,582
134
$109,203
30
$30,535
2
$50,200
APPLICATIONS APPROVED, NOT ACCEPTED
1
$192,490
2
$30,465
15
$154,451
6
$25,618
0
$0
APPLICATIONS DENIED
0
$0
8
$50,978
53
$109,974
8
$16,704
0
$0
APPLICATIONS WITHDRAWN
0
$0
4
$163,060
35
$111,734
1
$33,930
1
$82,400
FILES CLOSED FOR INCOMPLETENESS
0
$0
1
$188,330
6
$106,860
0
$0
0
$0
Aggregated Statistics For Year 2001 (Based on 2 partial tracts)
A) FHA, FSA/RHS & VA Home Purchase Loans
B) Conventional Home Purchase Loans
C) Refinancings
D) Home Improvement Loans
F) Non-occupant Loans on < 5 Family Dwellings (A B C & D)
Number
Average Value
Number
Average Value
Number
Average Value
Number
Average Value
Number
Average Value
LOANS ORIGINATED
9
$109,861
48
$100,686
116
$91,701
21
$27,729
4
$70,798
APPLICATIONS APPROVED, NOT ACCEPTED
0
$0
6
$67,855
12
$89,781
3
$31,850
1
$22,850
APPLICATIONS DENIED
1
$86,550
10
$51,168
32
$96,914
10
$16,202
0
$0
APPLICATIONS WITHDRAWN
1
$176,560
2
$91,745
32
$104,574
2
$24,235
1
$80,320
FILES CLOSED FOR INCOMPLETENESS
0
$0
1
$41,540
4
$119,440
1
$34,620
0
$0
Aggregated Statistics For Year 2000 (Based on 2 partial tracts)
A) FHA, FSA/RHS & VA Home Purchase Loans
B) Conventional Home Purchase Loans
C) Refinancings
D) Home Improvement Loans
E) Loans on Dwellings For 5+ Families
F) Non-occupant Loans on < 5 Family Dwellings (A B C & D)
Number
Average Value
Number
Average Value
Number
Average Value
Number
Average Value
Number
Average Value
Number
Average Value
LOANS ORIGINATED
8
$121,430
45
$110,646
48
$74,202
30
$21,464
1
$72,010
3
$90,937
APPLICATIONS APPROVED, NOT ACCEPTED
1
$87,240
6
$84,588
16
$97,628
2
$24,925
0
$0
0
$0
APPLICATIONS DENIED
1
$74,780
17
$79,219
24
$81,530
15
$18,603
0
$0
2
$43,275
APPLICATIONS WITHDRAWN
0
$0
6
$136,057
14
$85,610
3
$32,313
0
$0
1
$10,390
FILES CLOSED FOR INCOMPLETENESS
0
$0
0
$0
5
$85,580
0
$0
0
$0
0
$0
Aggregated Statistics For Year 1999 (Based on 1 partial tract)
A) FHA, FSA/RHS & VA Home Purchase Loans
B) Conventional Home Purchase Loans
C) Refinancings
D) Home Improvement Loans
F) Non-occupant Loans on < 5 Family Dwellings (A B C & D)
Detailed PMIC statistics for the following Tracts:0145.01
2004 - 2018 National Fire Incident Reporting System (NFIRS) incidents
According to the data from the years 2004 - 2018 the average number of fire incidents per year is 10. The highest number of reported fires - 25 took place in 2018, and the least - 1 in 2014. The data has a growing trend.
When looking into fire subcategories, the most incidents belonged to: Structure Fires (68.0%), and Outside Fires (27.2%).
Fire incident types reported to NFIRS in Zip Code 17565


 Nearest zip codes: 17532, 17516, 17584, 17551, 17560, 17302.


 (Students: 365, Location: 356 FROGTOWN RD, Grades: 7-8)


 According to the data from the years 2004 - 2018 the average number of fire incidents per year is 10. The highest number of reported fires - 25 took place in 2018, and the least - 1 in 2014. The data has a growing trend.
 When looking into fire subcategories, the most incidents belonged to: Structure Fires (68.0%), and Outside Fires (27.2%).