Estimated zip code population in 2022: 4,945 Zip code population in 2010: 4,496 Zip code population in 2000: 4,483
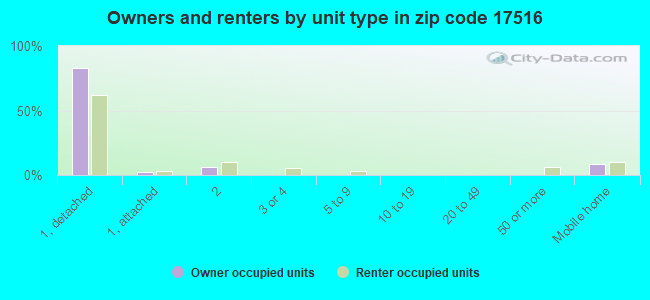
Houses and condos: 2,148 Renter-occupied apartments: 291
% of renters here:
14%
State:
31%
March 2022 cost of living index in zip code 17516: 92.8 (less than average, U.S. average is 100)
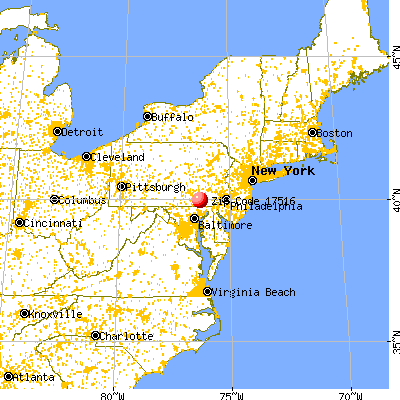
Land area: 20.8 sq. mi. Water area: 0.5 sq. mi.
Population density: 238 people per square mile
(very low).
OSM Map
General Map
Google Map
MSN Map
OSM Map
General Map
Google Map
MSN Map
OSM Map
General Map
Google Map
MSN Map
OSM Map
General Map
Google Map
MSN Map
Please wait while loading the map...
Real estate property taxes paid for housing units in 2022:
This zip code:
1.2% ($3,845)
Pennsylvania:
1.3% ($3,094)
Median real estate property taxes paid for housing units with mortgages in 2022: $4,369 (1.4%) Median real estate property taxes paid for housing units with no mortgage in 2022: $3,573 (1.2%)
Business Search- 14 Million verified businesses
Males: 2,505
(50.7%)
Females: 2,439
(49.3%)
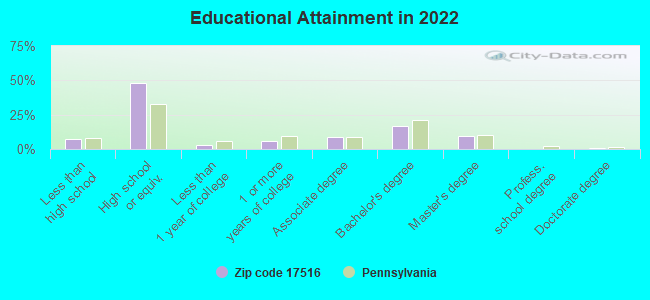
For population 25 years and over in 17516:
High school or higher: 91.5%
Bachelor's degree or higher: 26.9%
Graduate or professional degree: 10.4%
Unemployed: 0.7%
Mean travel time to work (commute): 26.7 minutes
For population 15 years and over in 17516:
Never married: 31.8%
Now married: 59.1%
Separated: 0.0%
Widowed: 5.3%
Divorced: 3.9%
Zip code 17516 compared to state average:
Unemployed percentage significantly below state average.
Black race population percentage significantly below state average.
Hispanic race population percentage below state average.
Median age significantly above state average.
Foreign-born population percentage significantly below state average.
Renting percentage below state average.
Length of stay since moving in above state average.
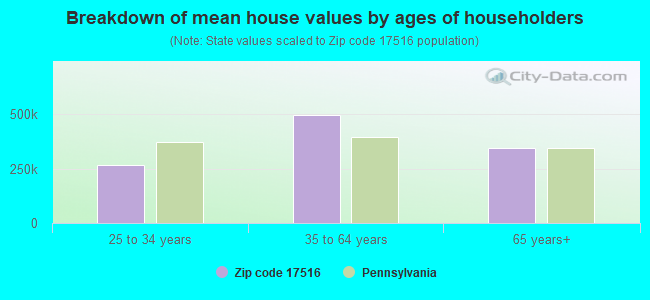
Estimated median house/condo value in 2022: $308,557
17516:
$308,557
Pennsylvania:
$245,500
According to our research of Pennsylvania and other state lists, there were 4 registered sex offenders living in 17516 zip code as of June 15, 2024. The ratio of all residents to sex offenders in zip code 17516 is 1,106 to 1. The ratio of registered sex offenders to all residents in this zip code is lower than the state average.
Median resident age:
This zip code:
49.9 years
Pennsylvania median age:
40.9 years
Average household size:
This zip code:
2.4 people
Pennsylvania:
2.4 people
Averages for the 2020 tax year for zip code 17516, filed in 2021:
Average Adjusted Gross Income (AGI) in 2020: $70,617 (Individual Income Tax Returns)
Here:
$70,617
State:
$75,707
Salary/wage: $58,705 (reported on 81.0% of returns)
Here:
$58,705
State:
$62,806
(% of AGI for various income ranges: 1064.0% for AGIs below $25k, 3392.1% for AGIs $25k-50k, 6236.0% for AGIs $50k-75k, 9152.9% for AGIs $75k-100k, 16450.4% for AGIs $100k-200k, 59320.0% for AGIs over 200k)
Taxable interest for individuals: $1,451 (reported on 32.7% of returns)
This zip code:
$1,451
Pennsylvania:
$1,633
(% of AGI for various income ranges: 27.1% for AGIs below $25k, 26.1% for AGIs $25k-50k, 22.8% for AGIs $50k-75k, 46.5% for AGIs $75k-100k, 191.6% for AGIs $100k-200k, 820.0% for AGIs over 200k)
Ordinary dividends: $6,106 (reported on 23.5% of returns)
Here:
$6,106
State:
$7,382
(% of AGI for various income ranges: 36.7% for AGIs below $25k, 46.1% for AGIs $25k-50k, 98.8% for AGIs $50k-75k, 161.8% for AGIs $75k-100k, 269.2% for AGIs $100k-200k, 5706.7% for AGIs over 200k)
Net capital gain/loss in AGI: +$16,206 (reported on 21.7% of returns)
Here:
+$16,206
State:
+$23,522
(% of AGI for various income ranges: 13.1% for AGIs below $25k, 46.3% for AGIs $25k-50k, 120.8% for AGIs $50k-75k, 157.6% for AGIs $75k-100k, 599.6% for AGIs $100k-200k, 18803.3% for AGIs over 200k)
Profit/loss from business: +$21,839 (reported on 15.9% of returns)
Here:
+$21,839
State:
+$16,274
(% of AGI for various income ranges: 137.4% for AGIs below $25k, 249.2% for AGIs $25k-50k, 282.4% for AGIs $50k-75k, 401.2% for AGIs $75k-100k, 564.4% for AGIs $100k-200k, 11796.7% for AGIs over 200k)
Taxable individual retirement arrangement distribution: $17,393 (reported on 11.9% of returns)
17516:
$17,393
Pennsylvania:
$18,583
(% of AGI for various income ranges: 123.8% for AGIs below $25k, 106.1% for AGIs $25k-50k, 302.0% for AGIs $50k-75k, 412.4% for AGIs $75k-100k, 926.8% for AGIs $100k-200k)
Total itemized deductions: $35,194 (reported on 7.5% of returns)
Here:
$35,194
State:
$34,850
(% of AGI for various income ranges: 442.8% for AGIs $50k-75k, 357.6% for AGIs $75k-100k, 948.0% for AGIs $100k-200k, 6326.7% for AGIs over 200k)
Charity contributions: $14,675 (reported on 5.3% of returns)
Here:
$14,675
State:
$12,392
(% of AGI for various income ranges: 113.6% for AGIs $50k-75k, 214.8% for AGIs $100k-200k, 3133.3% for AGIs over 200k)
Taxes paid: $8,047 (reported on 7.5% of returns)
17516:
$8,047
State:
$8,200
(% of AGI for various income ranges: 121.6% for AGIs $50k-75k, 81.2% for AGIs $75k-100k, 229.6% for AGIs $100k-200k, 1173.3% for AGIs over 200k)
Earned income credit: $1,959 (reported on 9.7% of returns)
Here:
$1,959
State:
$2,100
(% of AGI for various income ranges: 59.0% for AGIs below $25k, 48.2% for AGIs $25k-50k)
Percentage of individuals using paid preparers for their 2020 taxes: 92.9%
Here:
93%
State:
92%
(% for various income ranges: 91.0% for AGIs below $25k, 93.9% for AGIs $25k-50k, 94.3% for AGIs $50k-75k, 92.0% for AGIs $75k-100k, 92.7% for AGIs $100k-200k, 100.0% for AGIs over 200k)
Averages for the 2012 tax year for zip code 17516, filed in 2013:
Average Adjusted Gross Income (AGI) in 2012: $59,786 (Individual Income Tax Returns)
Here:
$59,786
State:
$61,346
Salary/wage: $47,929 (reported on 85.4% of returns)
Here:
$47,929
State:
$51,902
(% of AGI for various income ranges: 70.9% for AGIs below $25k, 79.6% for AGIs $25k-50k, 77.7% for AGIs $50k-75k, 74.0% for AGIs $75k-100k, 79.9% for AGIs $100k-200k, 35.3% for AGIs over 200k)
Taxable interest for individuals: $1,294 (reported on 36.3% of returns)
This zip code:
$1,294
Pennsylvania:
$1,588
(% of AGI for various income ranges: 1.0% for AGIs below $25k, 0.6% for AGIs $25k-50k, 0.4% for AGIs $50k-75k, 0.5% for AGIs $75k-100k, 0.4% for AGIs $100k-200k, 1.8% for AGIs over 200k)
Ordinary dividends: $14,691 (reported on 24.3% of returns)
Here:
$14,691
State:
$5,827
(% of AGI for various income ranges: 2.0% for AGIs below $25k, 1.1% for AGIs $25k-50k, 0.5% for AGIs $50k-75k, 0.8% for AGIs $75k-100k, 0.7% for AGIs $100k-200k, 25.0% for AGIs over 200k)
Net capital gain/loss in AGI: +$7,926 (reported on 16.8% of returns)
Here:
+$7,926
State:
+$14,495
(% of AGI for various income ranges: 0.1% for AGIs $25k-50k, 0.2% for AGIs $50k-75k, 1.6% for AGIs $100k-200k, 8.4% for AGIs over 200k)
Profit/loss from business: +$20,230 (reported on 16.4% of returns)
Here:
+$20,230
State:
+$16,268
(% of AGI for various income ranges: 6.4% for AGIs below $25k, 3.0% for AGIs $25k-50k, 3.4% for AGIs $50k-75k, 6.1% for AGIs $75k-100k, 3.3% for AGIs $100k-200k, 10.7% for AGIs over 200k)
Taxable individual retirement arrangement distribution: $9,415 (reported on 11.9% of returns)
17516:
$9,415
Pennsylvania:
$14,550
(% of AGI for various income ranges: 4.8% for AGIs below $25k, 2.3% for AGIs $25k-50k, 2.4% for AGIs $50k-75k, 1.6% for AGIs $75k-100k, 2.3% for AGIs $100k-200k)
Total itemized deductions: $22,408 (20% of AGI, reported on 34.1% of returns)
Here:
$22,408
State:
$23,538
Here:
19.8% of AGI
State:
18.4% of AGI
(% of AGI for various income ranges: 10.6% for AGIs below $25k, 9.3% for AGIs $25k-50k, 12.2% for AGIs $50k-75k, 15.8% for AGIs $75k-100k, 14.1% for AGIs $100k-200k, 12.1% for AGIs over 200k)
Charity contributions: $4,933 (reported on 26.5% of returns)
Here:
$4,933
State:
$4,025
(% of AGI for various income ranges: 0.7% for AGIs below $25k, 0.9% for AGIs $25k-50k, 1.6% for AGIs $50k-75k, 2.6% for AGIs $75k-100k, 2.3% for AGIs $100k-200k, 3.5% for AGIs over 200k)
Taxes paid: $8,888 (reported on 34.1% of returns)
17516:
$8,888
State:
$9,982
(% of AGI for various income ranges: 2.4% for AGIs below $25k, 3.0% for AGIs $25k-50k, 4.7% for AGIs $50k-75k, 6.5% for AGIs $75k-100k, 6.1% for AGIs $100k-200k, 5.2% for AGIs over 200k)
Earned income credit: $1,787 (reported on 10.2% of returns)
Here:
$1,787
State:
$2,106
(% of AGI for various income ranges: 3.5% for AGIs below $25k, 0.6% for AGIs $25k-50k)
Percentage of individuals using paid preparers for their 2012 taxes: 60.6%
Here:
61%
State:
53%
(% for various income ranges: 52.4% for AGIs below $25k, 59.2% for AGIs $25k-50k, 66.7% for AGIs $50k-75k, 65.4% for AGIs $75k-100k, 70.4% for AGIs $100k-200k, 83.3% for AGIs over 200k)
Averages for the 2004 tax year for zip code 17516, filed in 2005:
Average Adjusted Gross Income (AGI) in 2004: $49,452 (Individual Income Tax Returns)
Here:
$49,452
State:
$48,049
Salary/wage: $44,234 (reported on 87.6% of returns)
Here:
$44,234
State:
$42,646
(% of AGI for various income ranges: 92.6% for AGIs below $10k, 71.1% for AGIs $10k-25k, 83.9% for AGIs $25k-50k, 86.0% for AGIs $50k-75k, 84.8% for AGIs $75k-100k, 67.0% for AGIs over 100k)
Taxable interest for individuals: $1,159 (reported on 49.4% of returns)
This zip code:
$1,159
Pennsylvania:
$1,657
(% of AGI for various income ranges: 3.2% for AGIs below $10k, 2.5% for AGIs $10k-25k, 1.0% for AGIs $25k-50k, 0.5% for AGIs $50k-75k, 0.4% for AGIs $75k-100k, 1.7% for AGIs over 100k)
Taxable dividends: $3,116 (reported on 28.6% of returns)
Here:
$3,116
State:
$3,566
(% of AGI for various income ranges: 2.6% for AGIs below $10k, 1.4% for AGIs $10k-25k, 0.6% for AGIs $25k-50k, 0.4% for AGIs $50k-75k, 0.8% for AGIs $75k-100k, 4.1% for AGIs over 100k)
Net capital gain/loss: +$4,570 (reported on 18.5% of returns)
Here:
+$4,570
State:
+$9,716
(% of AGI for various income ranges: -1.0% for AGIs below $10k, 0.7% for AGIs $10k-25k, 0.2% for AGIs $25k-50k, 0.1% for AGIs $50k-75k, 1.2% for AGIs $75k-100k, 4.3% for AGIs over 100k)
Profit/loss from business: +$15,557 (reported on 17.1% of returns)
Here:
+$15,557
State:
+$14,267
(% of AGI for various income ranges: 1.6% for AGIs below $10k, 8.0% for AGIs $10k-25k, 5.1% for AGIs $25k-50k, 4.9% for AGIs $50k-75k, 4.7% for AGIs $75k-100k, 5.9% for AGIs over 100k)
Profit/loss from farming: +$347 (reported on 2.3% of returns)
Here:
+$347
State:
+$274
IRA payment deduction: $2,806 (reported on 3.1% of returns)
17516:
$2,806
Pennsylvania:
$2,903
Total itemized deductions: $17,688 (20% of AGI, reported on 36.0% of returns)
Here:
$17,688
State:
$18,804
Here:
20.0% of AGI
State:
19.5% of AGI
(% of AGI for various income ranges: 11.1% for AGIs below $10k, 7.8% for AGIs $10k-25k, 10.7% for AGIs $25k-50k, 13.8% for AGIs $50k-75k, 14.1% for AGIs $75k-100k, 14.0% for AGIs over 100k)
Charity contributions deductions: $3,943 (4% of AGI, reported on 30.7% of returns)
Here:
$3,943
State:
$3,337
Here:
4.1% of AGI
State:
3.3% of AGI
(% of AGI for various income ranges: 1.3% for AGIs $10k-25k, 1.1% for AGIs $25k-50k, 1.9% for AGIs $50k-75k, 2.0% for AGIs $75k-100k, 4.2% for AGIs over 100k)
Total tax: $7,327 (reported on 79.0% of returns)
17516:
$7,327
State:
$8,008
(% of AGI for various income ranges: 2.7% for AGIs below $10k, 5.5% for AGIs $10k-25k, 7.0% for AGIs $25k-50k, 8.3% for AGIs $50k-75k, 10.7% for AGIs $75k-100k, 19.1% for AGIs over 100k)
Earned income credit: $1,419 (reported on 8.8% of returns)
Here:
$1,419
State:
$1,643
Percentage of individuals using paid preparers for their 2004 taxes: 61.2%
Here:
61%
State:
56%
(% for various income ranges: 49.6% for AGIs below $10k, 56.2% for AGIs $10k-25k, 63.4% for AGIs $25k-50k, 65.4% for AGIs $50k-75k, 69.5% for AGIs $75k-100k, 73.8% for AGIs over 100k)
Household received Food Stamps/SNAP in the past 12 months: 169 Household did not receive Food Stamps/SNAP in the past 12 months: 1,881
Women who had a birth in the past 12 months: 45 (10 now married, 30 unmarried) Women who did not have a birth in the past 12 months: 807 (382 now married, 423 unmarried)
Housing units in zip code 17516 with a mortgage: 1,055 (180 second mortgage, 179 both second mortgage and home equity loan) Houses without a mortgage: 40
Median monthly owner costs for units with a mortgage: $1,897 Median monthly owner costs for units without a mortgage: $656
Residents with income below the poverty level in 2022:
This zip code:
5.2%
Whole state:
11.8%
Residents with income below 50% of the poverty level in 2022:
This zip code:
3.7%
Whole state:
6.1%
Median number of rooms in houses and condos:
Here:
7.0
State:
6.8
Median number of rooms in apartments:
Here:
4.3
State:
4.3
Notable locations in this zip code not listed on our city pages
Notable locations in zip code 17516: Pittsburg (A), Star Rock Dairy (B), Highville Fire Company Quick Response Service 7 - 8 (C), Conestoga Volunteer Fire Company (D). Display/hide their locations on the map
Churches in zip code 17516 include: Green Hill Church (A), River Corner Church (B), Colemanville Church (C), Salem Church (D), Bethany Church (E). Display/hide their locations on the map
Streams, rivers, and creeks: Goods Run (A), Frys Run (B), Fisherman Run (C), Conestoga River (D), Silver Mine Run (E), Witmer Run (F), Wisslers Run (G), Manns Run (H). Display/hide their locations on the map
Size of family households: 752 2-persons, 324 3-persons, 129 4-persons, 204 5-persons, 39 6-persons, 12 7-or-more-persons
Size of nonfamily households: 462 1-person, 133 2-persons
683 married couples with children.
80 single-parent households (26 men, 54 women).
93.5% of residents of 17516 zip code speak English at home.
0.6% of residents speak Spanish at home (79% very well, 21% not well).
5.3% of residents speak other Indo-European language at home (55% very well, 45% well).
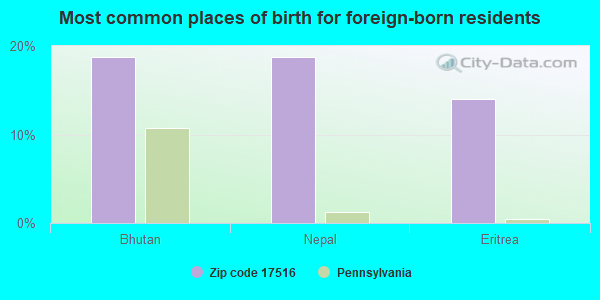
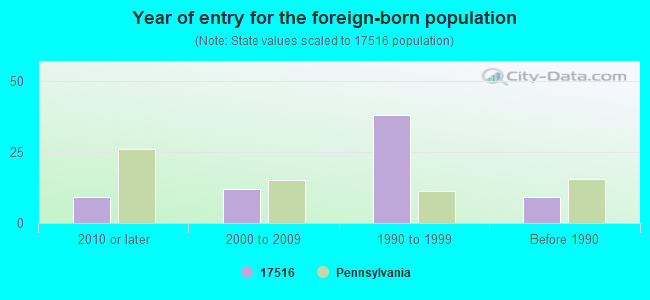
Foreign born population: 64 (1.3%) (54.2% of them are naturalized citizens)
This zip code:
1.3%
Whole state:
7.5%
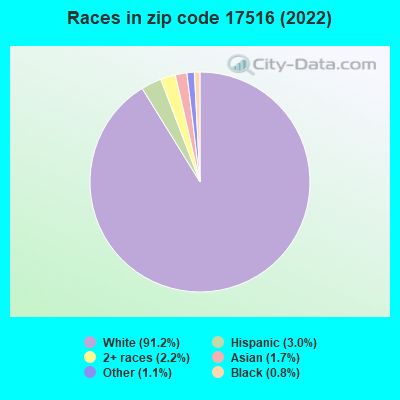
19%Bhutan
19%Nepal
14%Eritrea
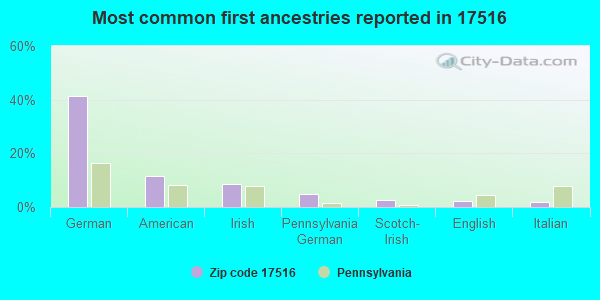
41%German
11%American
8%Irish
5%Pennsylvania German
3%Scotch-Irish
2%English
2%Italian
Year of entry for the foreign-born population
92010 or later
122000 to 2009
381990 to 1999
9Before 1990
Housing units lacking complete kitchen facilities: 1.7%
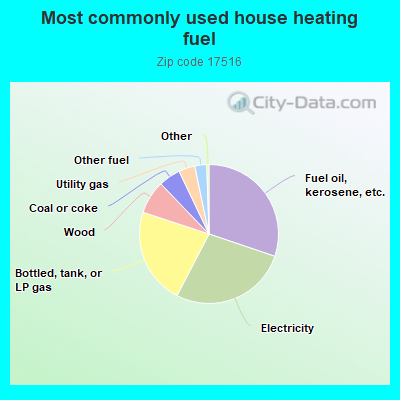
30.3%Fuel oil, kerosene, etc.
27.5%Electricity
22.5%Bottled, tank, or LP gas
7.8%Wood
5.1%Coal or coke
3.8%Utility gas
2.8%Other fuel
Population in 1990: 4,493.
Place of birth for U.S.-born residents:
This state: 4,313
Northeast: 164
Midwest: 107
South: 143
West: 112
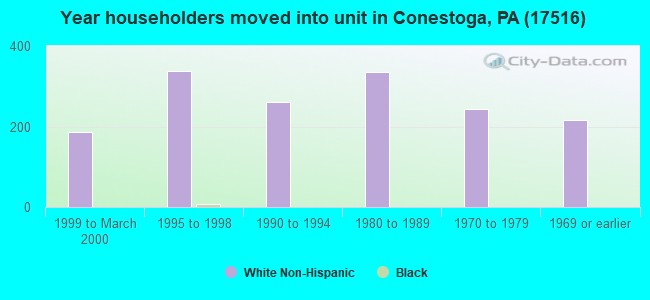
74% of the 17516 zip code residents lived in the same house 5 years ago. Out of people who lived in different houses, 87% lived in this county. Out of people who lived in different counties, 50% lived in Pennsylvania.
91% of the 17516 zip code residents lived in the same house 1 year ago. Out of people who lived in different houses, 74% moved from this county. Out of people who lived in different houses, 22% moved from different state. Out of people who lived in different houses, 4% moved from abroad.
Private vs. public school enrollment:
Students in private schools in grades 1 to 8 (elementary and middle school): 125
Here:
29.2%
Pennsylvania:
15.7%
Students in private schools in grades 9 to 12 (high school): 13
Here:
9.8%
Pennsylvania:
13.4%
Students in private undergraduate colleges: 20
Here:
10.1%
Pennsylvania:
39.8%
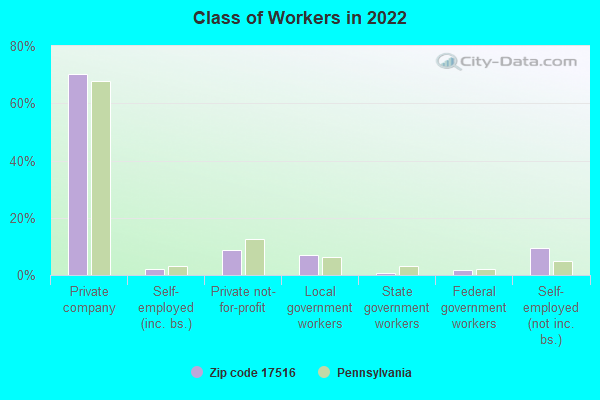
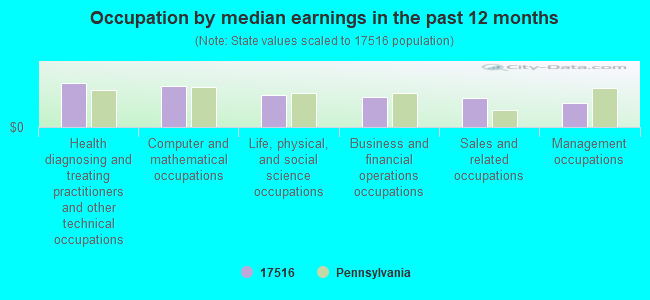
Occupation by median earnings in the past 12 months ($)
118,137Health diagnosing and treating practitioners and other technical occupations
111,159Computer and mathematical occupations
87,208Life, physical, and social science occupations
80,116Business and financial operations occupations
78,164Sales and related occupations
63,631Management occupations
Top industries in this zip code by the number of employees in 2005:
Utilities: Hydroelectric Power Generation (50-99 employees: 1 establishment)
Administrative and Support and Waste Management and Remediation Services: Landscaping Services (10-19: 2, 1-4: 5)
Accommodation and Food Services: Full-Service Restaurants (20-49: 1)
Other Services (except Public Administration): Religious Organizations (10-19: 1, 1-4: 3)
Construction: Plumbing, Heating, and Air-Conditioning Contractors (10-19: 1, 1-4: 2)
Other Services (except Public Administration): Automotive Body, Paint, and Interior Repair and Maintenance (10-19: 1)
Construction: New Single-Family Housing Construction (except Operative Builders) (5-9: 1, 1-4: 1)
Administrative and Support and Waste Management and Remediation Services: Janitorial Services (5-9: 1, 1-4: 1)
Health Care and Social Assistance: Ambulance Services (5-9: 1)
Fatal accident statistics in 2013:
Fatal accident count: 1
Vehicles involved in fatal accidents: 2
Fatal accidents caused by drunken drivers: 1
Fatalities: 1
Persons involved in fatal accidents: 3
Pedestrians involved in fatal accidents: 0
Home Mortgage Disclosure Act Aggregated Statistics For Year 2009 (Based on 8 partial tracts)
A) FHA, FSA/RHS & VA Home Purchase Loans
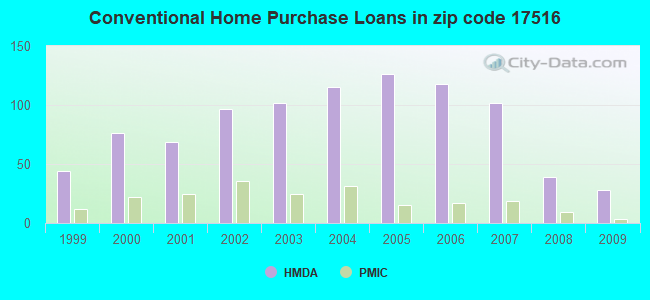
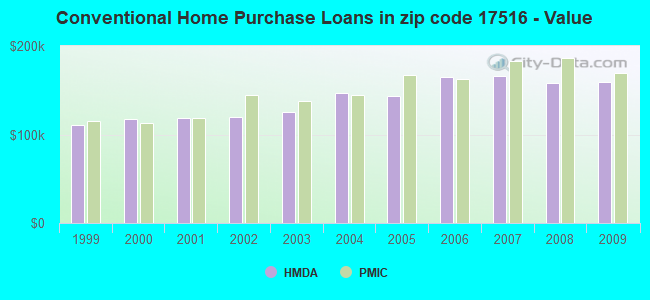
B) Conventional Home Purchase Loans
C) Refinancings
D) Home Improvement Loans
F) Non-occupant Loans on < 5 Family Dwellings (A B C & D)
G) Loans On Manufactured Home Dwelling (A B C & D)
Number
Average Value
Number
Average Value
Number
Average Value
Number
Average Value
Number
Average Value
Number
Average Value
LOANS ORIGINATED
21
$187,622
28
$158,955
177
$184,390
26
$133,647
4
$169,145
2
$45,145
APPLICATIONS APPROVED, NOT ACCEPTED
2
$148,435
1
$23,040
13
$235,059
3
$39,710
0
$0
0
$0
APPLICATIONS DENIED
1
$105,770
10
$90,653
65
$189,114
17
$37,839
2
$81,585
3
$54,630
APPLICATIONS WITHDRAWN
2
$148,600
3
$145,687
24
$193,785
2
$65,185
0
$0
0
$0
FILES CLOSED FOR INCOMPLETENESS
0
$0
0
$0
5
$175,852
1
$53,150
0
$0
0
$0
Aggregated Statistics For Year 2008 (Based on 8 partial tracts)
A) FHA, FSA/RHS & VA Home Purchase Loans
B) Conventional Home Purchase Loans
C) Refinancings
D) Home Improvement Loans
F) Non-occupant Loans on < 5 Family Dwellings (A B C & D)
G) Loans On Manufactured Home Dwelling (A B C & D)
Number
Average Value
Number
Average Value
Number
Average Value
Number
Average Value
Number
Average Value
Number
Average Value
LOANS ORIGINATED
14
$178,251
39
$157,736
129
$140,723
40
$46,586
12
$123,062
7
$67,433
APPLICATIONS APPROVED, NOT ACCEPTED
2
$139,605
8
$77,546
18
$191,673
2
$16,750
3
$32,973
6
$33,210
APPLICATIONS DENIED
1
$175,820
5
$127,878
63
$201,053
29
$72,468
2
$205,855
3
$28,457
APPLICATIONS WITHDRAWN
2
$151,735
1
$372,200
18
$173,743
4
$55,008
1
$54,980
0
$0
FILES CLOSED FOR INCOMPLETENESS
0
$0
0
$0
3
$150,360
0
$0
0
$0
0
$0
Aggregated Statistics For Year 2007 (Based on 8 partial tracts)
A) FHA, FSA/RHS & VA Home Purchase Loans
B) Conventional Home Purchase Loans
C) Refinancings
D) Home Improvement Loans
F) Non-occupant Loans on < 5 Family Dwellings (A B C & D)
G) Loans On Manufactured Home Dwelling (A B C & D)
Number
Average Value
Number
Average Value
Number
Average Value
Number
Average Value
Number
Average Value
Number
Average Value
LOANS ORIGINATED
3
$217,007
102
$166,459
159
$139,707
88
$46,282
12
$128,271
8
$56,219
APPLICATIONS APPROVED, NOT ACCEPTED
1
$226,110
11
$113,738
28
$132,907
8
$34,888
1
$65,010
6
$45,197
APPLICATIONS DENIED
0
$0
12
$94,894
68
$158,035
25
$82,301
6
$183,702
4
$43,102
APPLICATIONS WITHDRAWN
2
$201,500
8
$102,075
39
$177,687
2
$23,470
0
$0
2
$49,940
FILES CLOSED FOR INCOMPLETENESS
0
$0
2
$151,565
8
$204,081
0
$0
0
$0
0
$0
Aggregated Statistics For Year 2006 (Based on 8 partial tracts)
A) FHA, FSA/RHS & VA Home Purchase Loans
B) Conventional Home Purchase Loans
C) Refinancings
D) Home Improvement Loans
E) Loans on Dwellings For 5+ Families
F) Non-occupant Loans on < 5 Family Dwellings (A B C & D)
G) Loans On Manufactured Home Dwelling (A B C & D)
Number
Average Value
Number
Average Value
Number
Average Value
Number
Average Value
Number
Average Value
Number
Average Value
Number
Average Value
LOANS ORIGINATED
1
$223,030
118
$164,999
140
$118,119
78
$42,327
1
$70,660
10
$141,062
6
$45,248
APPLICATIONS APPROVED, NOT ACCEPTED
0
$0
9
$149,982
14
$127,608
6
$52,963
0
$0
0
$0
1
$59,700
APPLICATIONS DENIED
5
$147,322
20
$306,676
85
$151,904
24
$40,050
0
$0
5
$99,370
3
$62,987
APPLICATIONS WITHDRAWN
0
$0
12
$107,098
46
$127,681
2
$61,295
0
$0
0
$0
0
$0
FILES CLOSED FOR INCOMPLETENESS
0
$0
3
$203,630
8
$145,918
0
$0
0
$0
0
$0
0
$0
Aggregated Statistics For Year 2005 (Based on 8 partial tracts)
A) FHA, FSA/RHS & VA Home Purchase Loans
B) Conventional Home Purchase Loans
C) Refinancings
D) Home Improvement Loans
F) Non-occupant Loans on < 5 Family Dwellings (A B C & D)
G) Loans On Manufactured Home Dwelling (A B C & D)
Number
Average Value
Number
Average Value
Number
Average Value
Number
Average Value
Number
Average Value
Number
Average Value
LOANS ORIGINATED
5
$156,238
126
$143,971
230
$115,769
68
$41,361
10
$136,157
7
$67,521
APPLICATIONS APPROVED, NOT ACCEPTED
0
$0
14
$135,371
36
$134,272
7
$79,246
6
$117,317
3
$42,453
APPLICATIONS DENIED
0
$0
18
$117,589
116
$133,618
20
$61,069
8
$77,521
6
$24,025
APPLICATIONS WITHDRAWN
0
$0
5
$204,404
95
$144,065
8
$154,496
0
$0
1
$50,880
FILES CLOSED FOR INCOMPLETENESS
0
$0
3
$178,150
13
$178,795
1
$35,030
0
$0
0
$0
Aggregated Statistics For Year 2004 (Based on 8 partial tracts)
A) FHA, FSA/RHS & VA Home Purchase Loans
B) Conventional Home Purchase Loans
C) Refinancings
D) Home Improvement Loans
E) Loans on Dwellings For 5+ Families
F) Non-occupant Loans on < 5 Family Dwellings (A B C & D)
G) Loans On Manufactured Home Dwelling (A B C & D)
Number
Average Value
Number
Average Value
Number
Average Value
Number
Average Value
Number
Average Value
Number
Average Value
Number
Average Value
LOANS ORIGINATED
4
$124,395
115
$147,362
211
$102,680
66
$46,974
1
$164,260
13
$115,486
5
$44,788
APPLICATIONS APPROVED, NOT ACCEPTED
3
$96,570
17
$165,237
46
$96,959
9
$37,621
0
$0
0
$0
6
$47,578
APPLICATIONS DENIED
1
$62,330
17
$138,919
105
$128,324
21
$52,786
0
$0
1
$22,380
4
$79,842
APPLICATIONS WITHDRAWN
1
$175,240
7
$86,079
69
$126,920
1
$43,980
0
$0
0
$0
4
$66,530
FILES CLOSED FOR INCOMPLETENESS
0
$0
2
$130,965
13
$152,320
2
$67,455
0
$0
0
$0
0
$0
Aggregated Statistics For Year 2003 (Based on 8 partial tracts)
A) FHA, FSA/RHS & VA Home Purchase Loans
B) Conventional Home Purchase Loans
C) Refinancings
D) Home Improvement Loans
E) Loans on Dwellings For 5+ Families
F) Non-occupant Loans on < 5 Family Dwellings (A B C & D)
Number
Average Value
Number
Average Value
Number
Average Value
Number
Average Value
Number
Average Value
Number
Average Value
LOANS ORIGINATED
3
$119,100
102
$125,278
406
$117,803
51
$32,295
1
$129,830
8
$84,131
APPLICATIONS APPROVED, NOT ACCEPTED
0
$0
8
$122,658
48
$103,828
6
$68,827
0
$0
1
$262,480
APPLICATIONS DENIED
0
$0
19
$83,820
111
$123,316
13
$20,665
1
$565,280
4
$34,228
APPLICATIONS WITHDRAWN
0
$0
4
$111,320
92
$136,578
2
$7,460
0
$0
2
$80,860
FILES CLOSED FOR INCOMPLETENESS
0
$0
1
$50,640
10
$90,263
1
$24,610
0
$0
0
$0
Aggregated Statistics For Year 2002 (Based on 8 partial tracts)
A) FHA, FSA/RHS & VA Home Purchase Loans
B) Conventional Home Purchase Loans
C) Refinancings
D) Home Improvement Loans
F) Non-occupant Loans on < 5 Family Dwellings (A B C & D)
Number
Average Value
Number
Average Value
Number
Average Value
Number
Average Value
Number
Average Value
LOANS ORIGINATED
16
$120,436
97
$119,462
265
$109,603
48
$31,302
11
$67,189
APPLICATIONS APPROVED, NOT ACCEPTED
0
$0
5
$138,992
40
$134,270
5
$71,526
0
$0
APPLICATIONS DENIED
1
$154,040
25
$38,079
89
$110,701
7
$25,503
1
$72,740
APPLICATIONS WITHDRAWN
0
$0
5
$97,830
58
$130,720
3
$12,730
2
$48,680
FILES CLOSED FOR INCOMPLETENESS
0
$0
2
$60,920
6
$135,735
0
$0
2
$60,920
Aggregated Statistics For Year 2001 (Based on 8 partial tracts)
A) FHA, FSA/RHS & VA Home Purchase Loans
B) Conventional Home Purchase Loans
C) Refinancings
D) Home Improvement Loans
E) Loans on Dwellings For 5+ Families
F) Non-occupant Loans on < 5 Family Dwellings (A B C & D)
Number
Average Value
Number
Average Value
Number
Average Value
Number
Average Value
Number
Average Value
Number
Average Value
LOANS ORIGINATED
16
$114,394
69
$118,234
212
$83,831
52
$29,239
1
$113,060
6
$76,495
APPLICATIONS APPROVED, NOT ACCEPTED
1
$82,730
7
$86,486
13
$77,151
11
$34,960
0
$0
0
$0
APPLICATIONS DENIED
0
$0
24
$62,332
70
$83,578
11
$26,016
0
$0
1
$121,540
APPLICATIONS WITHDRAWN
0
$0
3
$75,370
33
$113,198
7
$41,527
0
$0
0
$0
FILES CLOSED FOR INCOMPLETENESS
0
$0
0
$0
6
$99,135
0
$0
0
$0
0
$0
Aggregated Statistics For Year 2000 (Based on 8 partial tracts)
A) FHA, FSA/RHS & VA Home Purchase Loans
B) Conventional Home Purchase Loans
C) Refinancings
D) Home Improvement Loans
E) Loans on Dwellings For 5+ Families
F) Non-occupant Loans on < 5 Family Dwellings (A B C & D)
Number
Average Value
Number
Average Value
Number
Average Value
Number
Average Value
Number
Average Value
Number
Average Value
LOANS ORIGINATED
7
$115,439
76
$117,936
90
$71,389
69
$21,238
1
$582,240
6
$59,337
APPLICATIONS APPROVED, NOT ACCEPTED
0
$0
7
$52,147
28
$72,319
5
$36,400
0
$0
0
$0
APPLICATIONS DENIED
0
$0
5
$94,248
35
$87,370
22
$17,916
0
$0
1
$48,050
APPLICATIONS WITHDRAWN
1
$176,650
4
$91,462
31
$86,602
6
$20,463
0
$0
0
$0
FILES CLOSED FOR INCOMPLETENESS
0
$0
0
$0
11
$99,541
2
$54,830
0
$0
0
$0
Aggregated Statistics For Year 1999 (Based on 4 partial tracts)
A) FHA, FSA/RHS & VA Home Purchase Loans
B) Conventional Home Purchase Loans
C) Refinancings
D) Home Improvement Loans
F) Non-occupant Loans on < 5 Family Dwellings (A B C & D)
2002 - 2018 National Fire Incident Reporting System (NFIRS) incidents
According to the data from the years 2002 - 2018 the average number of fire incidents per year is 24. The highest number of reported fire incidents - 78 took place in 2006, and the least - 1 in 2013. The data has a decreasing trend.
When looking into fire subcategories, the most reports belonged to: Structure Fires (63.4%), and Outside Fires (26.5%).
Fire incident types reported to NFIRS in Zip Code 17516


 Nearest zip codes: 17551, 17565, 17603, 17309, 17582, 17554.


 According to the data from the years 2002 - 2018 the average number of fire incidents per year is 24. The highest number of reported fire incidents - 78 took place in 2006, and the least - 1 in 2013. The data has a decreasing trend.
 When looking into fire subcategories, the most reports belonged to: Structure Fires (63.4%), and Outside Fires (26.5%).