Estimated zip code population in 2022: 1,291 Zip code population in 2010: 640 Zip code population in 2000: 497
March 2022 cost of living index in zip code 22654: 84.3 (less than average, U.S. average is 100)
Land area: 61.8 sq. mi. Water area: 0.1 sq. mi.
Population density: 21 people per square mile
(very low).
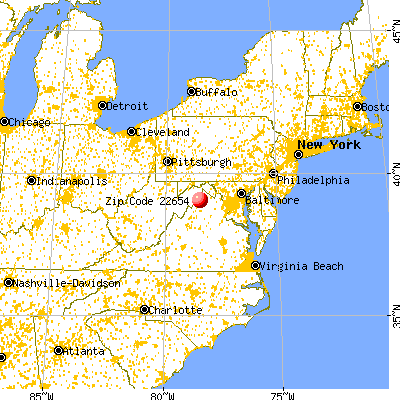
OSM Map
General Map
Google Map
MSN Map
OSM Map
General Map
Google Map
MSN Map
OSM Map
General Map
Google Map
MSN Map
OSM Map
General Map
Google Map
MSN Map
Please wait while loading the map...
Real estate property taxes paid for housing units in 2022:
This zip code:
0.6% ($1,960)
Virginia:
0.7% ($2,617)
Median real estate property taxes paid for housing units with mortgages in 2022: $2,160 (0.7%) Median real estate property taxes paid for housing units with no mortgage in 2022: $1,920 (0.4%)
Business Search- 14 Million verified businesses
Males: 665
(51.5%)
Females: 626
(48.5%)
For population 25 years and over in 22654:
High school or higher: 84.1%
Bachelor's degree or higher: 21.2%
Graduate or professional degree: 9.4%
Unemployed: 4.3%
Mean travel time to work (commute): 45.0 minutes
For population 15 years and over in 22654:
Never married: 1.4%
Now married: 78.6%
Separated: 3.1%
Widowed: 7.0%
Divorced: 10.0%
Zip code 22654 compared to state average:
Black race population percentage significantly below state average.
Hispanic race population percentage below state average.
Median age significantly above state average.
Foreign-born population percentage significantly below state average.
Renting percentage significantly below state average.
House age below state average.
Number of college students significantly below state average.
Percentage of population with a bachelor's degree or higher below state average.
Estimated median house/condo value in 2022: $339,440
22654:
$339,440
Virginia:
$365,700
According to our research of Virginia and other state lists, there were 3 registered sex offenders living in 22654 zip code as of June 16, 2024. The ratio of all residents to sex offenders in zip code 22654 is 473 to 1. The ratio of registered sex offenders to all residents in this zip code is lower than the state average.
Median resident age:
This zip code:
56.4 years
Virginia median age:
39.0 years
Average household size:
This zip code:
2.7 people
Virginia:
2.5 people
Averages for the 2020 tax year for zip code 22654, filed in 2021:
Average Adjusted Gross Income (AGI) in 2020: $79,237 (Individual Income Tax Returns)
Here:
$79,237
State:
$86,446
Salary/wage: $71,045 (reported on 81.6% of returns)
Here:
$71,045
State:
$71,185
(% of AGI for various income ranges: 980.0% for AGIs below $25k, 3750.0% for AGIs $25k-50k, 5280.0% for AGIs $50k-75k, 8550.0% for AGIs $75k-100k, 15448.0% for AGIs $100k-200k)
Taxable interest for individuals: $473 (reported on 28.9% of returns)
This zip code:
$473
Virginia:
$1,805
(% of AGI for various income ranges: 31.4% for AGIs below $25k, 22.0% for AGIs $50k-75k, 38.0% for AGIs $100k-200k)
Ordinary dividends: $1,712 (reported on 21.1% of returns)
Here:
$1,712
State:
$8,327
(% of AGI for various income ranges: 54.3% for AGIs below $25k, 42.0% for AGIs $50k-75k, 156.0% for AGIs $100k-200k)
Net capital gain/loss in AGI: +$5,257 (reported on 18.4% of returns)
Here:
+$5,257
State:
+$24,644
(% of AGI for various income ranges: 7.1% for AGIs below $25k, 34.0% for AGIs $50k-75k, 692.0% for AGIs $100k-200k)
Profit/loss from business: +$2,840 (reported on 13.2% of returns)
Here:
+$2,840
State:
+$12,836
(% of AGI for various income ranges: 218.6% for AGIs below $25k)
Taxable individual retirement arrangement distribution: $9,767 (reported on 7.9% of returns)
22654:
$9,767
Virginia:
$21,535
(% of AGI for various income ranges: 586.0% for AGIs $50k-75k)
Total itemized deductions: $22,800 (reported on 7.9% of returns)
Here:
$22,800
State:
$33,287
(% of AGI for various income ranges: 1368.0% for AGIs $100k-200k)
Taxes paid: $8,633 (reported on 7.9% of returns)
22654:
$8,633
State:
$8,284
(% of AGI for various income ranges: 518.0% for AGIs $100k-200k)
Earned income credit: $2,300 (reported on 7.9% of returns)
Here:
$2,300
State:
$2,214
(% of AGI for various income ranges: 98.6% for AGIs below $25k)
Percentage of individuals using paid preparers for their 2020 taxes: 92.1%
Here:
92%
State:
92%
(% for various income ranges: 100.0% for AGIs below $25k, 87.5% for AGIs $25k-50k, 83.3% for AGIs $50k-75k, 100.0% for AGIs $75k-100k, 85.7% for AGIs $100k-200k, 100.0% for AGIs over 200k)
Averages for the 2012 tax year for zip code 22654, filed in 2013:
Average Adjusted Gross Income (AGI) in 2012: $59,773 (Individual Income Tax Returns)
Here:
$59,773
State:
$71,192
Salary/wage: $55,116 (reported on 86.5% of returns)
Here:
$55,116
State:
$59,229
(% of AGI for various income ranges: 69.9% for AGIs below $25k, 82.2% for AGIs $25k-50k, 74.4% for AGIs $50k-75k, 90.3% for AGIs $75k-100k, 79.1% for AGIs $100k-200k)
Taxable interest for individuals: $754 (reported on 35.1% of returns)
This zip code:
$754
Virginia:
$1,600
(% of AGI for various income ranges: 2.6% for AGIs below $25k, 0.3% for AGIs $25k-50k, 0.3% for AGIs $50k-75k, 0.4% for AGIs $100k-200k)
Ordinary dividends: $2,114 (reported on 18.9% of returns)
Here:
$2,114
State:
$6,959
(% of AGI for various income ranges: 2.8% for AGIs below $25k, 0.2% for AGIs $50k-75k, 1.1% for AGIs $100k-200k)
Profit/loss from business: +$2,500 (reported on 13.5% of returns)
Here:
+$2,500
State:
+$14,116
Taxable individual retirement arrangement distribution: $6,333 (reported on 8.1% of returns)
22654:
$6,333
Virginia:
$16,667
Total itemized deductions: $22,387 (23% of AGI, reported on 40.5% of returns)
Here:
$22,387
State:
$26,596
Here:
22.6% of AGI
State:
20.1% of AGI
(% of AGI for various income ranges: 31.4% for AGIs below $25k, 14.2% for AGIs $50k-75k, 17.2% for AGIs $75k-100k, 17.8% for AGIs $100k-200k)
Charity contributions: $3,091 (reported on 29.7% of returns)
Here:
$3,091
State:
$4,443
Taxes paid: $7,353 (reported on 40.5% of returns)
22654:
$7,353
State:
$9,951
(% of AGI for various income ranges: 7.9% for AGIs below $25k, 3.3% for AGIs $50k-75k, 5.6% for AGIs $75k-100k, 6.8% for AGIs $100k-200k)
Earned income credit: $1,775 (reported on 10.8% of returns)
Here:
$1,775
State:
$2,211
(% of AGI for various income ranges: 5.6% for AGIs below $25k)
Percentage of individuals using paid preparers for their 2012 taxes: 48.6%
Here:
49%
State:
46%
(% for various income ranges: 45.5% for AGIs below $25k, 44.4% for AGIs $25k-50k, 57.1% for AGIs $50k-75k, 50.0% for AGIs $75k-100k, 50.0% for AGIs $100k-200k)
Averages for the 2004 tax year for zip code 22654, filed in 2005:
Average Adjusted Gross Income (AGI) in 2004: $44,153 (Individual Income Tax Returns)
Here:
$44,153
State:
$56,704
Salary/wage: $41,121 (reported on 83.7% of returns)
Here:
$41,121
State:
$48,441
(% of AGI for various income ranges: 91.4% for AGIs below $10k, 67.6% for AGIs $10k-25k, 81.2% for AGIs $25k-50k, 83.9% for AGIs $50k-75k, 84.2% for AGIs $75k-100k, 63.9% for AGIs over 100k)
Taxable interest for individuals: $657 (reported on 42.9% of returns)
This zip code:
$657
Virginia:
$1,688
(% of AGI for various income ranges: 2.6% for AGIs below $10k, 1.4% for AGIs $10k-25k, 1.4% for AGIs $25k-50k, 0.2% for AGIs $50k-75k, 0.4% for AGIs $75k-100k, 0.1% for AGIs over 100k)
Taxable dividends: $565 (reported on 19.0% of returns)
Here:
$565
State:
$4,028
(% of AGI for various income ranges: 1.0% for AGIs $10k-25k, 0.2% for AGIs $25k-50k, 0.3% for AGIs $50k-75k, 0.1% for AGIs $75k-100k)
Net capital gain/loss: +$5,283 (reported on 14.1% of returns)
Here:
+$5,283
State:
+$14,375
(% of AGI for various income ranges: -0.4% for AGIs $10k-25k, 0.0% for AGIs $25k-50k, 0.2% for AGIs $50k-75k, 8.5% for AGIs $75k-100k)
Profit/loss from business: +$6,373 (reported on 18.1% of returns)
Here:
+$6,373
State:
+$13,342
(% of AGI for various income ranges: 15.9% for AGIs below $10k, 11.4% for AGIs $10k-25k, 2.1% for AGIs $25k-50k, 4.6% for AGIs $75k-100k)
Total itemized deductions: $16,583 (24% of AGI, reported on 35.3% of returns)
Here:
$16,583
State:
$21,492
Here:
23.7% of AGI
State:
21.0% of AGI
(% of AGI for various income ranges: 49.1% for AGIs below $10k, 11.0% for AGIs $25k-50k, 12.1% for AGIs $50k-75k, 16.4% for AGIs $75k-100k, 16.8% for AGIs over 100k)
Charity contributions deductions: $1,633 (2% of AGI, reported on 27.6% of returns)
Here:
$1,633
State:
$3,794
Here:
2.3% of AGI
State:
3.5% of AGI
(% of AGI for various income ranges: 1.3% for AGIs $25k-50k, 0.8% for AGIs $50k-75k, 1.2% for AGIs $75k-100k, 1.2% for AGIs over 100k)
Total tax: $5,239 (reported on 83.4% of returns)
22654:
$5,239
State:
$9,537
(% of AGI for various income ranges: 3.4% for AGIs below $10k, 5.8% for AGIs $10k-25k, 7.6% for AGIs $25k-50k, 8.0% for AGIs $50k-75k, 11.2% for AGIs $75k-100k, 15.8% for AGIs over 100k)
Earned income credit: $1,472 (reported on 11.0% of returns)
Here:
$1,472
State:
$1,734
Percentage of individuals using paid preparers for their 2004 taxes: 54.6%
Here:
55%
State:
52%
(% for various income ranges: 52.0% for AGIs below $10k, 53.5% for AGIs $10k-25k, 48.9% for AGIs $25k-50k, 65.0% for AGIs $50k-75k, 50.0% for AGIs $75k-100k, 66.7% for AGIs over 100k)
Household received Food Stamps/SNAP in the past 12 months: 42 Household did not receive Food Stamps/SNAP in the past 12 months: 439
Women who did not have a birth in the past 12 months: 152 (148 now married, 0 unmarried)
Housing units in zip code 22654 with a mortgage: 233 (13 second mortgage, 13 both second mortgage and home equity loan) Median monthly owner costs for units with a mortgage: $1,565 Median monthly owner costs for units without a mortgage: $378
Residents with income below the poverty level in 2022:
This zip code:
4.5%
Whole state:
10.6%
Residents with income below 50% of the poverty level in 2022:
This zip code:
1.8%
Whole state:
5.2%
Median number of rooms in houses and condos:
Here:
6.6
State:
7.0
Notable locations in this zip code not listed on our city pages
Notable locations in zip code 22654: Sugar Knob Camp (A), Paul Gerhart Shelter (B), Winchester Camp (C), Star Tannery (D), Frederick County Fire and Rescue Department Station 17 - Star Tannery Volunteer Fire and Rescue (E). Display/hide their locations on the map
Streams, rivers, and creeks: Rocky Run (A), Spruce Run (B), Paddy Run (C), Mill Creek (D), Laurel Run (E), Cold Spring Run (F). Display/hide their locations on the map
Year house built (houses)
02020 or later
252010 to 2019
2932000 to 2009
1751990 to 1999
271980 to 1989
851970 to 1979
341960 to 1969
111950 to 1959
01940 to 1949
151939 or earlier
Bedrooms in owner-occupied houses and condos in 22654
0no bedroom
01 bedroom
872 bedrooms
3573 bedrooms
414 bedrooms
05+ bedrooms
Cars and other vehicles available in 22654 in owner-occupied houses/condos
0no vehicle
361 vehicle
2572 vehicles
753 vehicles
1124 vehicles
05+ vehicles
Zip code 22654 household income distribution in 2022
22Less than $10,000
10$15,000 to $19,999
10$20,000 to $24,999
7$25,000 to $29,999
29$35,000 to $39,999
35$50,000 to $59,999
182$60,000 to $74,999
58$75,000 to $99,999
44$100,000 to $124,999
30$125,000 to $149,999
35$150,000 to $199,999
15$200,000 or more
Estimate of home value of owner-occupied houses/condos in 2022 in zip code 22654
5$90,000 to $99,999
32$100,000 to $124,999
56$150,000 to $174,999
46$200,000 to $249,999
69$250,000 to $299,999
72$300,000 to $399,999
136$400,000 to $499,999
16$500,000 to $749,999
39$750,000 to $999,999
Estimated median house (or condo) value in 2022 for:
White Non-Hispanic householders: $262,198
Estimated median house or condo value in 2022: $339,440
22654:
$339,440
Virginia:
$365,700
Lower value quartile - upper value quartile: $234,003 - $483,313
Mean price in 2022:
Detached houses: $275,987
Here:
$275,987
State:
$472,865
Housing units in structures:
One, detached: 607
Mobile homes: 61
Unemployment: 4.3%
Means of transportation to work in zip code 22654
85.8%376Drove a car alone
3.0%13Carpooled
8.9%39Worked at home
Travel time to work (commute) in zip code 22654
1210 to 14 minutes
7420 to 24 minutes
3425 to 29 minutes
10230 to 34 minutes
2835 to 39 minutes
1645 to 59 minutes
1860 to 89 minutes
10090 or more minutes
Percentage of zip code residents living and working in this county: 48.3%
Household type by relationship:
Households: 1,291
Male householders: 169 (16 living alone), Female householders: 315 (7 living alone)
Size of family households: 293 2-persons, 43 3-persons, 19 4-persons, 92 5-persons
Size of nonfamily households: 22 1-person, 7 2-persons
251 married couples with children.
0 single-parent households ().
100.3% of residents of 22654 zip code speak English at home.
Foreign born population: 74 (5.8%) (100.0% of them are naturalized citizens)
This zip code:
5.8%
Whole state:
12.7%
96%Costa Rica
58%American
14%German
5%English
3%Scotch-Irish
2%Irish
Year of entry for the foreign-born population
412010 or later
02000 to 2009
01990 to 1999
32Before 1990
47.1%Electricity
23.1%Wood
19.3%Bottled, tank, or LP gas
5.1%Fuel oil, kerosene, etc.
4.5%Utility gas
1.5%Other fuel
Population in 1990: 332. Population change in the 1990s: +165 (+49.7%).
Place of birth for U.S.-born residents:
This state: 853
Northeast: 148
Midwest: 84
South: 101
West: 27
63% of the 22654 zip code residents lived in the same house 5 years ago. Out of people who lived in different houses, 50% lived in this county. Out of people who lived in different counties, 50% lived in Virginia.
101% of the 22654 zip code residents lived in the same house 1 year ago.
Private vs. public school enrollment:
Students in private schools in grades 1 to 8 (elementary and middle school): 48
Here:
30.8%
Virginia:
13.2%
Occupation by median earnings in the past 12 months ($)
85,997Management occupations
60,925Sales and related occupations
Top industries in this zip code by the number of employees in 2005:
Professional, Scientific, and Technical Services: Offices of Certified Public Accountants (10-19 employees: 1 establishment)
Accommodation and Food Services: Full-Service Restaurants (10-19: 1)
Construction: Site Preparation Contractors (1-4: 1)
Construction: Poured Concrete Foundation and Structure Contractors (1-4: 1)
Accommodation and Food Services: Drinking Places (Alcoholic Beverages) (1-4: 1)
Construction: Painting and Wall Covering Contractors (1-4: 1)
Fatal accident statistics in 2013:
Fatal accident count: 1
Vehicles involved in fatal accidents: 1
Fatal accidents caused by drunken drivers: 1
Fatalities: 1
Persons involved in fatal accidents: 1
Pedestrians involved in fatal accidents: 0
Home Mortgage Disclosure Act Aggregated Statistics For Year 2009 (Based on 2 partial tracts)
A) FHA, FSA/RHS & VA Home Purchase Loans
B) Conventional Home Purchase Loans
C) Refinancings
D) Home Improvement Loans
F) Non-occupant Loans on < 5 Family Dwellings (A B C & D)
G) Loans On Manufactured Home Dwelling (A B C & D)
Number
Average Value
Number
Average Value
Number
Average Value
Number
Average Value
Number
Average Value
Number
Average Value
LOANS ORIGINATED
26
$168,938
12
$173,012
80
$183,195
5
$70,350
8
$162,552
2
$86,085
APPLICATIONS APPROVED, NOT ACCEPTED
1
$169,820
1
$108,140
5
$187,938
0
$0
1
$118,290
1
$65,590
APPLICATIONS DENIED
4
$116,828
3
$130,003
33
$187,167
1
$106,970
3
$195,980
2
$151,280
APPLICATIONS WITHDRAWN
3
$118,160
2
$191,685
26
$171,250
1
$124,150
2
$102,285
2
$68,905
FILES CLOSED FOR INCOMPLETENESS
1
$291,240
0
$0
4
$235,510
0
$0
0
$0
0
$0
Aggregated Statistics For Year 2008 (Based on 2 partial tracts)
A) FHA, FSA/RHS & VA Home Purchase Loans
B) Conventional Home Purchase Loans
C) Refinancings
D) Home Improvement Loans
F) Non-occupant Loans on < 5 Family Dwellings (A B C & D)
G) Loans On Manufactured Home Dwelling (A B C & D)
Number
Average Value
Number
Average Value
Number
Average Value
Number
Average Value
Number
Average Value
Number
Average Value
LOANS ORIGINATED
18
$175,094
21
$188,173
64
$178,638
10
$102,519
8
$152,890
3
$97,730
APPLICATIONS APPROVED, NOT ACCEPTED
1
$115,170
2
$115,365
11
$175,290
0
$0
2
$133,320
0
$0
APPLICATIONS DENIED
7
$162,127
7
$205,461
56
$246,935
7
$179,696
2
$172,555
4
$132,930
APPLICATIONS WITHDRAWN
1
$194,030
2
$164,360
20
$239,998
1
$145,230
3
$132,087
0
$0
FILES CLOSED FOR INCOMPLETENESS
0
$0
1
$401,720
5
$213,080
1
$188,170
0
$0
0
$0
Aggregated Statistics For Year 2007 (Based on 2 partial tracts)
A) FHA, FSA/RHS & VA Home Purchase Loans
B) Conventional Home Purchase Loans
C) Refinancings
D) Home Improvement Loans
F) Non-occupant Loans on < 5 Family Dwellings (A B C & D)
G) Loans On Manufactured Home Dwelling (A B C & D)
Number
Average Value
Number
Average Value
Number
Average Value
Number
Average Value
Number
Average Value
Number
Average Value
LOANS ORIGINATED
9
$211,250
61
$181,056
102
$177,613
19
$84,018
10
$178,569
2
$160,650
APPLICATIONS APPROVED, NOT ACCEPTED
0
$0
2
$237,170
18
$185,852
1
$52,310
1
$167,870
1
$101,890
APPLICATIONS DENIED
1
$133,520
14
$156,606
67
$216,777
11
$103,385
4
$147,278
3
$117,510
APPLICATIONS WITHDRAWN
1
$172,950
3
$194,290
30
$193,105
4
$136,640
0
$0
0
$0
FILES CLOSED FOR INCOMPLETENESS
0
$0
1
$178,410
16
$213,402
1
$175,680
1
$195,980
0
$0
Aggregated Statistics For Year 2006 (Based on 2 partial tracts)
A) FHA, FSA/RHS & VA Home Purchase Loans
B) Conventional Home Purchase Loans
C) Refinancings
D) Home Improvement Loans
F) Non-occupant Loans on < 5 Family Dwellings (A B C & D)
G) Loans On Manufactured Home Dwelling (A B C & D)
Number
Average Value
Number
Average Value
Number
Average Value
Number
Average Value
Number
Average Value
Number
Average Value
LOANS ORIGINATED
6
$247,253
98
$168,019
132
$182,051
19
$81,778
14
$161,876
5
$108,922
APPLICATIONS APPROVED, NOT ACCEPTED
0
$0
11
$168,759
24
$193,915
3
$54,397
3
$165,010
0
$0
APPLICATIONS DENIED
0
$0
21
$138,834
69
$212,202
8
$63,099
2
$215,890
2
$156,160
APPLICATIONS WITHDRAWN
0
$0
13
$180,815
52
$212,228
5
$124,616
1
$269,380
1
$179,580
FILES CLOSED FOR INCOMPLETENESS
0
$0
2
$207,500
12
$166,928
0
$0
1
$141,320
0
$0
Aggregated Statistics For Year 2005 (Based on 2 partial tracts)
A) FHA, FSA/RHS & VA Home Purchase Loans
B) Conventional Home Purchase Loans
C) Refinancings
D) Home Improvement Loans
F) Non-occupant Loans on < 5 Family Dwellings (A B C & D)
G) Loans On Manufactured Home Dwelling (A B C & D)
Number
Average Value
Number
Average Value
Number
Average Value
Number
Average Value
Number
Average Value
Number
Average Value
LOANS ORIGINATED
5
$190,202
84
$175,308
139
$153,464
19
$91,025
11
$180,578
5
$91,042
APPLICATIONS APPROVED, NOT ACCEPTED
0
$0
9
$125,796
20
$147,142
4
$66,952
1
$36,310
0
$0
APPLICATIONS DENIED
0
$0
20
$172,498
68
$164,192
12
$71,833
2
$98,380
4
$101,700
APPLICATIONS WITHDRAWN
0
$0
7
$165,753
49
$151,873
10
$149,172
2
$124,340
0
$0
FILES CLOSED FOR INCOMPLETENESS
0
$0
3
$141,323
5
$165,998
1
$118,290
0
$0
0
$0
Aggregated Statistics For Year 2004 (Based on 2 partial tracts)
A) FHA, FSA/RHS & VA Home Purchase Loans
B) Conventional Home Purchase Loans
C) Refinancings
D) Home Improvement Loans
F) Non-occupant Loans on < 5 Family Dwellings (A B C & D)
G) Loans On Manufactured Home Dwelling (A B C & D)
Detailed PMIC statistics for the following Tracts:0504.00
2002 - 2018 National Fire Incident Reporting System (NFIRS) incidents
According to the data from the years 2002 - 2018 the average number of fires per year is 9. The highest number of fires - 20 took place in 2007, and the least - 1 in 2018. The data has a dropping trend.
When looking into fire subcategories, the most incidents belonged to: Outside Fires (41.8%), and Structure Fires (32.2%).
Fire incident types reported to NFIRS in Zip Code 22654


 Nearest zip codes: 26851, 22644, 22664, 22660, 22824, 26823.


 According to the data from the years 2002 - 2018 the average number of fires per year is 9. The highest number of fires - 20 took place in 2007, and the least - 1 in 2018. The data has a dropping trend.
 When looking into fire subcategories, the most incidents belonged to: Outside Fires (41.8%), and Structure Fires (32.2%).