Estimated zip code population in 2022: 1,457 Zip code population in 2010: 2,180 Zip code population in 2000: 1,908
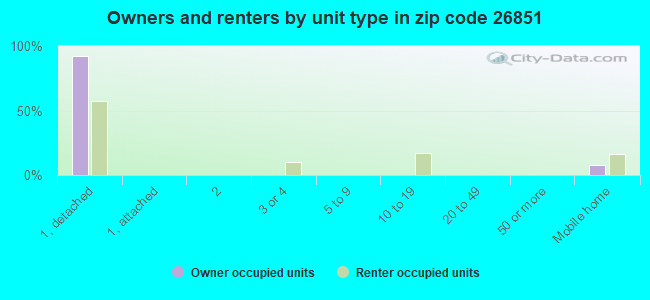
Houses and condos: 1,388 Renter-occupied apartments: 133
% of renters here:
17%
State:
26%
March 2022 cost of living index in zip code 26851: 85.9 (less than average, U.S. average is 100)
Land area: 108.6 sq. mi. Water area: 0.4 sq. mi.
Population density: 13 people per square mile
(very low).
OSM Map
General Map
Google Map
MSN Map
OSM Map
General Map
Google Map
MSN Map
OSM Map
General Map
Google Map
MSN Map
OSM Map
General Map
Google Map
MSN Map
Please wait while loading the map...
Real estate property taxes paid for housing units in 2022:
This zip code:
0.3% ($644)
West Virginia:
0.5% ($821)
Median real estate property taxes paid for housing units with mortgages in 2022: $654 (0.3%) Median real estate property taxes paid for housing units with no mortgage in 2022: $621 (0.3%)
Averages for the 2020 tax year for zip code 26851, filed in 2021:
Average Adjusted Gross Income (AGI) in 2020: $51,271 (Individual Income Tax Returns)
Here:
$51,271
State:
$56,292
Salary/wage: $48,040 (reported on 80.6% of returns)
Here:
$48,040
State:
$49,093
(% of AGI for various income ranges: 1034.8% for AGIs below $25k, 3401.9% for AGIs $25k-50k, 5974.5% for AGIs $50k-75k, 8183.8% for AGIs $75k-100k, 16733.8% for AGIs $100k-200k)
Taxable interest for individuals: $1,046 (reported on 30.1% of returns)
This zip code:
$1,046
West Virginia:
$1,141
(% of AGI for various income ranges: 41.7% for AGIs below $25k, 20.0% for AGIs $25k-50k, 20.0% for AGIs $50k-75k, 53.8% for AGIs $75k-100k, 112.5% for AGIs $100k-200k)
Ordinary dividends: $2,313 (reported on 16.1% of returns)
Here:
$2,313
State:
$5,456
(% of AGI for various income ranges: 15.7% for AGIs below $25k, 23.3% for AGIs $25k-50k, 60.9% for AGIs $50k-75k, 90.0% for AGIs $75k-100k, 153.8% for AGIs $100k-200k)
Net capital gain/loss in AGI: +$3,680 (reported on 10.8% of returns)
Here:
+$3,680
State:
+$11,656
(% of AGI for various income ranges: 24.3% for AGIs below $25k, 18.6% for AGIs $25k-50k, 170.0% for AGIs $50k-75k, 107.5% for AGIs $100k-200k)
Profit/loss from business: +$1,962 (reported on 14.0% of returns)
Here:
+$1,962
State:
+$12,084
(% of AGI for various income ranges: 61.9% for AGIs $25k-50k, 65.5% for AGIs $50k-75k, 147.5% for AGIs $100k-200k)
Taxable individual retirement arrangement distribution: $13,050 (reported on 8.6% of returns)
26851:
$13,050
West Virginia:
$15,311
(% of AGI for various income ranges: 94.8% for AGIs below $25k, 151.4% for AGIs $25k-50k, 635.0% for AGIs $75k-100k)
Total itemized deductions: $26,067 (reported on 3.2% of returns)
Here:
$26,067
State:
$31,950
(% of AGI for various income ranges: 977.5% for AGIs $100k-200k)
Charity contributions: $5,850 (reported on 2.2% of returns)
Here:
$5,850
State:
$12,364
(% of AGI for various income ranges: 106.4% for AGIs $50k-75k)
Taxes paid: $8,200 (reported on 3.2% of returns)
26851:
$8,200
State:
$7,665
(% of AGI for various income ranges: 307.5% for AGIs $100k-200k)
Earned income credit: $2,214 (reported on 15.1% of returns)
Here:
$2,214
State:
$2,258
(% of AGI for various income ranges: 86.1% for AGIs below $25k, 53.3% for AGIs $25k-50k)
Percentage of individuals using paid preparers for their 2020 taxes: 92.5%
Here:
92%
State:
93%
(% for various income ranges: 90.6% for AGIs below $25k, 96.0% for AGIs $25k-50k, 92.9% for AGIs $50k-75k, 90.0% for AGIs $75k-100k, 91.7% for AGIs $100k-200k)
Averages for the 2012 tax year for zip code 26851, filed in 2013:
Average Adjusted Gross Income (AGI) in 2012: $43,358 (Individual Income Tax Returns)
Here:
$43,358
State:
$48,628
Salary/wage: $40,757 (reported on 79.1% of returns)
Here:
$40,757
State:
$42,328
(% of AGI for various income ranges: 72.9% for AGIs below $25k, 82.5% for AGIs $25k-50k, 75.6% for AGIs $50k-75k, 84.8% for AGIs $75k-100k, 59.3% for AGIs $100k-200k)
Taxable interest for individuals: $1,125 (reported on 30.8% of returns)
This zip code:
$1,125
West Virginia:
$1,211
(% of AGI for various income ranges: 2.3% for AGIs below $25k, 0.5% for AGIs $25k-50k, 1.1% for AGIs $50k-75k, 0.2% for AGIs $75k-100k, 0.5% for AGIs $100k-200k)
Ordinary dividends: $1,767 (reported on 16.5% of returns)
Here:
$1,767
State:
$4,262
(% of AGI for various income ranges: 1.7% for AGIs below $25k, 0.6% for AGIs $25k-50k, 0.7% for AGIs $50k-75k, 0.1% for AGIs $75k-100k, 0.7% for AGIs $100k-200k)
Net capital gain/loss in AGI: +$2,612 (reported on 8.8% of returns)
Here:
+$2,612
State:
+$8,875
(% of AGI for various income ranges: 0.6% for AGIs $50k-75k, 2.0% for AGIs $75k-100k)
Profit/loss from business: +$2,485 (reported on 14.3% of returns)
Here:
+$2,485
State:
+$13,636
(% of AGI for various income ranges: 1.9% for AGIs below $25k, 1.6% for AGIs $25k-50k, 1.5% for AGIs $75k-100k)
Taxable individual retirement arrangement distribution: $9,311 (reported on 9.9% of returns)
26851:
$9,311
West Virginia:
$11,787
(% of AGI for various income ranges: 3.8% for AGIs below $25k, 2.0% for AGIs $25k-50k, 5.0% for AGIs $50k-75k)
Total itemized deductions: $17,879 (24% of AGI, reported on 20.9% of returns)
Here:
$17,879
State:
$21,148
Here:
23.6% of AGI
State:
18.1% of AGI
(% of AGI for various income ranges: 9.1% for AGIs $25k-50k, 6.4% for AGIs $50k-75k, 11.6% for AGIs $75k-100k, 12.2% for AGIs $100k-200k)
Charity contributions: $3,009 (reported on 12.1% of returns)
Here:
$3,009
State:
$4,508
(% of AGI for various income ranges: 0.7% for AGIs $25k-50k, 0.8% for AGIs $50k-75k, 1.0% for AGIs $75k-100k, 1.3% for AGIs $100k-200k)
Taxes paid: $4,900 (reported on 20.9% of returns)
26851:
$4,900
State:
$8,103
(% of AGI for various income ranges: 1.3% for AGIs $25k-50k, 1.7% for AGIs $50k-75k, 3.2% for AGIs $75k-100k, 4.4% for AGIs $100k-200k)
Earned income credit: $2,012 (reported on 18.7% of returns)
Here:
$2,012
State:
$2,140
(% of AGI for various income ranges: 5.5% for AGIs below $25k, 1.1% for AGIs $25k-50k)
Percentage of individuals using paid preparers for their 2012 taxes: 61.5%
Here:
62%
State:
49%
(% for various income ranges: 56.8% for AGIs below $25k, 60.9% for AGIs $25k-50k, 68.8% for AGIs $50k-75k, 62.5% for AGIs $75k-100k, 71.4% for AGIs $100k-200k)
Averages for the 2004 tax year for zip code 26851, filed in 2005:
Average Adjusted Gross Income (AGI) in 2004: $35,119 (Individual Income Tax Returns)
Here:
$35,119
State:
$37,498
Salary/wage: $33,489 (reported on 85.0% of returns)
Here:
$33,489
State:
$33,645
(% of AGI for various income ranges: 85.6% for AGIs below $10k, 78.8% for AGIs $10k-25k, 84.0% for AGIs $25k-50k, 86.6% for AGIs $50k-75k, 85.5% for AGIs $75k-100k, 56.2% for AGIs over 100k)
Taxable interest for individuals: $1,374 (reported on 41.4% of returns)
This zip code:
$1,374
West Virginia:
$1,465
(% of AGI for various income ranges: 8.3% for AGIs below $10k, 2.4% for AGIs $10k-25k, 1.6% for AGIs $25k-50k, 0.8% for AGIs $50k-75k, 0.3% for AGIs $75k-100k, 2.9% for AGIs over 100k)
Taxable dividends: $1,450 (reported on 16.0% of returns)
Here:
$1,450
State:
$2,913
(% of AGI for various income ranges: 4.3% for AGIs below $10k, 1.4% for AGIs $10k-25k, 0.3% for AGIs $25k-50k, 0.3% for AGIs $50k-75k, 0.1% for AGIs $75k-100k, 1.5% for AGIs over 100k)
Net capital gain/loss: +$9,000 (reported on 9.7% of returns)
Here:
+$9,000
State:
+$6,331
(% of AGI for various income ranges: -2.5% for AGIs below $10k, -0.4% for AGIs $10k-25k, 0.2% for AGIs $25k-50k, 0.4% for AGIs $50k-75k, 20.2% for AGIs over 100k)
Profit/loss from business: +$2,023 (reported on 14.9% of returns)
Here:
+$2,023
State:
+$11,074
(% of AGI for various income ranges: 0.0% for AGIs below $10k, 5.6% for AGIs $10k-25k, 0.3% for AGIs $25k-50k, 1.2% for AGIs $50k-75k, -1.6% for AGIs $75k-100k)
IRA payment deduction: $1,947 (reported on 2.2% of returns)
26851:
$1,947
West Virginia:
$2,796
Total itemized deductions: $14,400 (23% of AGI, reported on 17.8% of returns)
Here:
$14,400
State:
$16,976
Here:
22.9% of AGI
State:
19.0% of AGI
(% of AGI for various income ranges: 5.0% for AGIs $10k-25k, 5.6% for AGIs $25k-50k, 7.0% for AGIs $50k-75k, 8.8% for AGIs $75k-100k, 14.8% for AGIs over 100k)
Charity contributions deductions: $2,544 (4% of AGI, reported on 11.8% of returns)
Here:
$2,544
State:
$3,529
Here:
3.8% of AGI
State:
3.7% of AGI
(% of AGI for various income ranges: 0.4% for AGIs $25k-50k, 1.0% for AGIs $50k-75k, 0.8% for AGIs $75k-100k, 2.9% for AGIs over 100k)
Total tax: $3,928 (reported on 73.2% of returns)
26851:
$3,928
State:
$5,372
(% of AGI for various income ranges: 2.4% for AGIs below $10k, 4.6% for AGIs $10k-25k, 6.7% for AGIs $25k-50k, 8.6% for AGIs $50k-75k, 10.4% for AGIs $75k-100k, 13.9% for AGIs over 100k)
Earned income credit: $1,531 (reported on 16.6% of returns)
Here:
$1,531
State:
$1,662
Percentage of individuals using paid preparers for their 2004 taxes: 69.9%
Here:
70%
State:
55%
(% for various income ranges: 68.1% for AGIs below $10k, 67.7% for AGIs $10k-25k, 68.9% for AGIs $25k-50k, 74.3% for AGIs $50k-75k, 69.6% for AGIs $75k-100k, 85.2% for AGIs over 100k)
Household received Food Stamps/SNAP in the past 12 months: 51 Household did not receive Food Stamps/SNAP in the past 12 months: 741
Women who had a birth in the past 12 months: 6 (5 now married, 0 unmarried) Women who did not have a birth in the past 12 months: 220 (125 now married, 94 unmarried)
Housing units in zip code 26851 with a mortgage: 362 (67 second mortgage, 58 both second mortgage and home equity loan) Median monthly owner costs for units with a mortgage: $1,154 Median monthly owner costs for units without a mortgage: $348
Residents with income below the poverty level in 2022:
This zip code:
14.1%
Whole state:
17.9%
Residents with income below 50% of the poverty level in 2022:
This zip code:
6.4%
Whole state:
9.7%
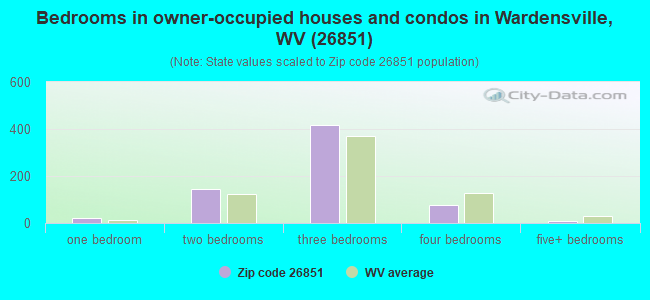
Median number of rooms in houses and condos:
Here:
6.1
State:
6.5
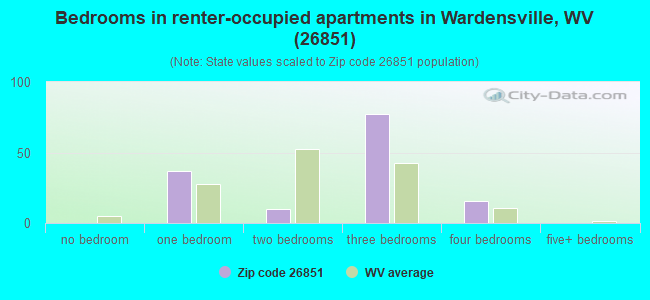
Median number of rooms in apartments:
Here:
4.7
State:
4.7
Notable locations in this zip code not listed on our city pages
Notable locations in zip code 26851: Camp Pinnacle (A), Camp Hemlock (B), Capon Furnace (C), Wardensville Volunteer Rescue Squad (D), Capon Valley Volunteer Fire Company (E). Display/hide their locations on the map
Churches in zip code 26851 include: Mount Vernon Church (A), Marvin Chapel (B), Hebron Church (C), Crest Hill Church (D), Cave Valley Presbyterian Church (E). Display/hide their locations on the map
Streams, rivers, and creeks: Hawk Run (A), Harness Run (B), Deep Gutter Run (C), Cove Run (D), Waites Run (E), Trout Run (F), Slate Rock Run (G), Sine Run (H), Sauerkraut Run (I). Display/hide their locations on the map
Parks in zip code 26851 include: Warden Lake Wildlife Management Area (1), Wolf Gap Recreation Area (2), Wardensville Wildlife Management Area (3). Display/hide their locations on the map
In group quarters: 28 (-1 institutionalized population)
Size of family households: 380 2-persons, 82 3-persons, 34 4-persons, 2 5-persons, 3 6-persons
Size of nonfamily households: 281 1-person, 16 2-persons
50 married couples with children.
68 single-parent households (26 men, 42 women).
99.4% of residents of 26851 zip code speak English at home.
0.7% of residents speak Spanish at home (50% very well, 50% not well).
Foreign born population: 1 (0.1%) (100.0% of them are naturalized citizens)
This zip code:
0.1%
Whole state:
1.8%
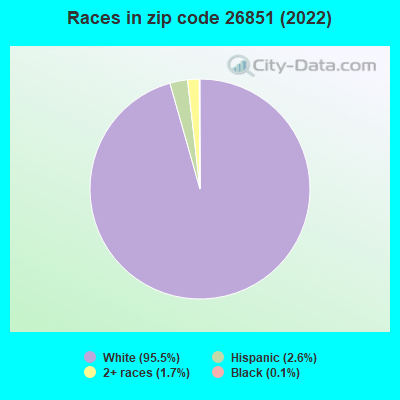
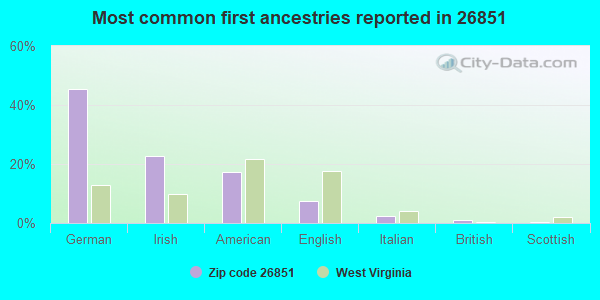
46%German
23%Irish
17%American
8%English
3%Italian
1%British
0%Scottish
Facilities with environmental interests located in this zip code:
FOREMOST INDUSTRIES INC (RT 55 WARDENSVILLE INDUSTRIAL in WARDENSVILLE, WV)
(Resource Conservation and Recovery Act (tracking hazardous waste)) Organizations: MR RALPH C MICHAEL (CONTACT/OWNER)
ANDERSON SALVAGE (96 KITTY ROAD in WARDENSVILLE, WV)
National Pollutant Discharge Elimination System NON-MAJOR (Tracking pollutant discharge elimination systems) - permit Business SIC classification: SCRAP AND WASTE MATERIALS Alternative names: ANDERSON, WILLIAM C., WILLIAM C ANDERSON
Housing units lacking complete plumbing facilities: 8.5% Housing units lacking complete kitchen facilities: 8.1%
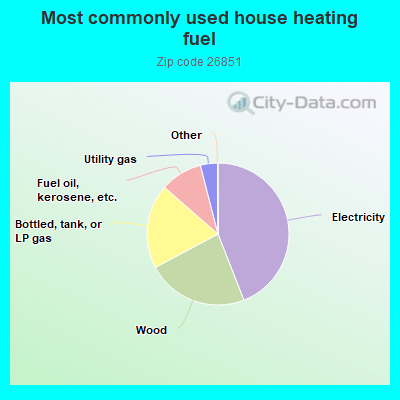
44.2%Electricity
23.2%Wood
19.3%Bottled, tank, or LP gas
9.6%Fuel oil, kerosene, etc.
3.9%Utility gas
Population in 1990: 1,606. Population change in the 1990s: +302 (+18.8%).
Place of birth for U.S.-born residents:
This state: 392
Northeast: 189
Midwest: 33
South: 797
West: 78
64% of the 26851 zip code residents lived in the same house 5 years ago. Out of people who lived in different houses, 43% lived in this county. Out of people who lived in different counties, 50% lived in West Virginia.
91% of the 26851 zip code residents lived in the same house 1 year ago. Out of people who lived in different houses, 73% moved from this county. Out of people who lived in different houses, 24% moved from different state.
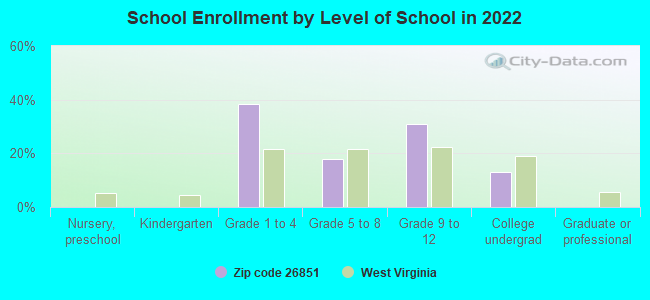
Private vs. public school enrollment:
Students in private schools in grades 1 to 8 (elementary and middle school):
Here:
0.0%
West Virginia:
12.2%
Students in private schools in grades 9 to 12 (high school):
Here:
0.0%
West Virginia:
8.8%
Students in private undergraduate colleges: 6
Here:
46.1%
West Virginia:
17.3%
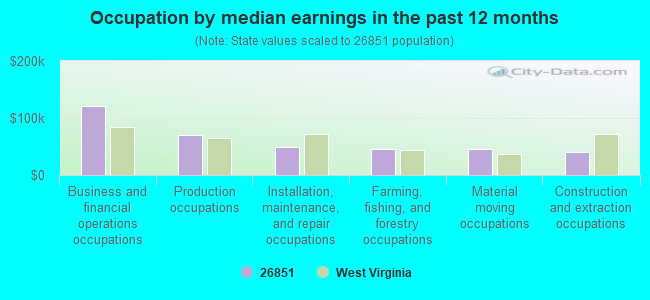
Occupation by median earnings in the past 12 months ($)
120,288Business and financial operations occupations
70,466Production occupations
49,652Installation, maintenance, and repair occupations
46,414Farming, fishing, and forestry occupations
45,032Material moving occupations
40,789Construction and extraction occupations
Top industries in this zip code by the number of employees in 2005:
Finance and Insurance: Commercial Banking (20-49 employees: 1 establishment)
Health Care and Social Assistance: Residential Mental Retardation Facilities (5-9: 4, 1-4: 2)
Accommodation and Food Services: Full-Service Restaurants (5-9: 2, 1-4: 1)
Other Services (except Public Administration): Funeral Homes and Funeral Services (5-9: 1)
People in group quarters in 2000:
16 people in homes for the mentally retarded
Fatal accident statistics in 2014:
Fatal accident count: 1
Vehicles involved in fatal accidents: 1
Fatal accidents caused by drunken drivers: 0
Fatalities: 1
Persons involved in fatal accidents: 1
Pedestrians involved in fatal accidents: 0
Fatal accident statistics in 2013:
Fatal accident count: 1
Vehicles involved in fatal accidents: 1
Fatal accidents caused by drunken drivers: 1
Fatalities: 1
Persons involved in fatal accidents: 1
Pedestrians involved in fatal accidents: 0
2002 - 2018 National Fire Incident Reporting System (NFIRS) incidents
Based on the data from the years 2002 - 2018 the average number of fires per year is 12. The highest number of reported fires - 29 took place in 2007, and the least - 4 in 2003. The data has an increasing trend.
When looking into fire subcategories, the most reports belonged to: Structure Fires (37.1%), and Outside Fires (35.7%).
Fire incident types reported to NFIRS in Zip Code 26851

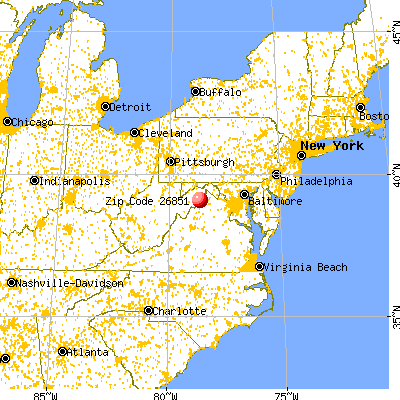


 Nearest zip codes: 22654, 26714, 26810, 22644, 26755, 26823.


 Based on the data from the years 2002 - 2018 the average number of fires per year is 12. The highest number of reported fires - 29 took place in 2007, and the least - 4 in 2003. The data has an increasing trend.
 When looking into fire subcategories, the most reports belonged to: Structure Fires (37.1%), and Outside Fires (35.7%).