Estimated zip code population in 2022: 5,685 Zip code population in 2010: 5,063 Zip code population in 2000: 4,563
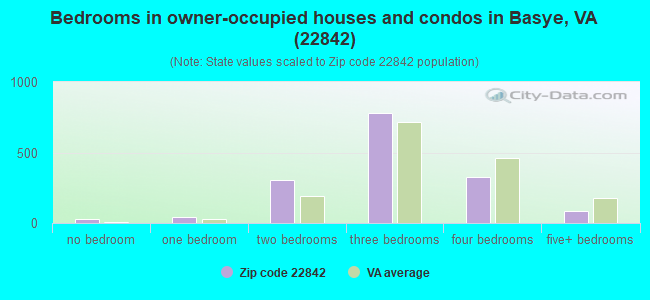
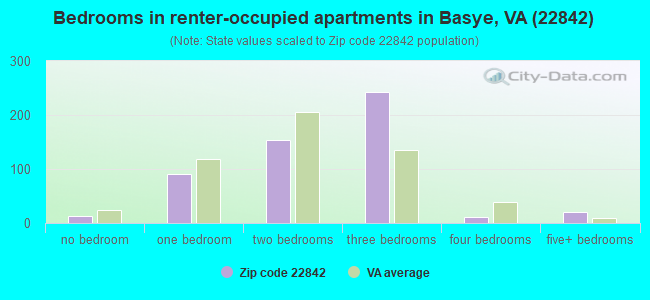
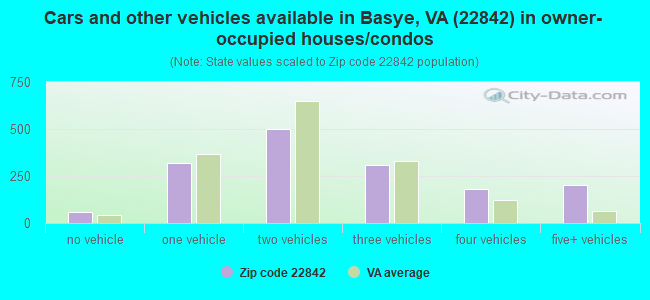
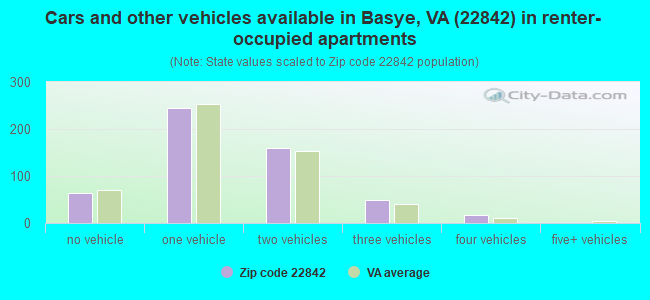
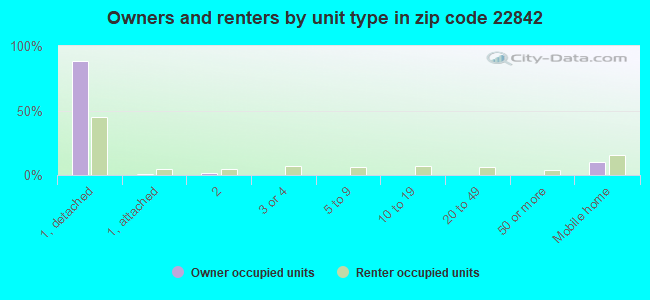
Houses and condos: 3,072 Renter-occupied apartments: 534
% of renters here:
25%
State:
33%
March 2022 cost of living index in zip code 22842: 85.2 (less than average, U.S. average is 100)
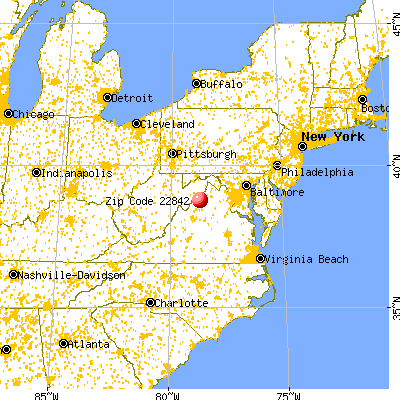
Land area: 72.5 sq. mi. Water area: 0.3 sq. mi.
Population density: 78 people per square mile
(very low).
OSM Map
General Map
Google Map
MSN Map
OSM Map
General Map
Google Map
MSN Map
OSM Map
General Map
Google Map
MSN Map
OSM Map
General Map
Google Map
MSN Map
Please wait while loading the map...
Real estate property taxes paid for housing units in 2022:
This zip code:
0.6% ($1,247)
Virginia:
0.7% ($2,617)
Median real estate property taxes paid for housing units with mortgages in 2022: $1,424 (0.6%) Median real estate property taxes paid for housing units with no mortgage in 2022: $1,067 (0.6%)
Estimated median house/condo value in 2022: $202,330
22842:
$202,330
Virginia:
$365,700
According to our research of Virginia and other state lists, there were 18 registered sex offenders living in 22842 zip code as of June 20, 2024. The ratio of all residents to sex offenders in zip code 22842 is 314 to 1. The ratio of registered sex offenders to all residents in this zip code is near the state average.
Median resident age:
This zip code:
46.5 years
Virginia median age:
39.0 years
Average household size:
This zip code:
2.7 people
Virginia:
2.5 people
Averages for the 2020 tax year for zip code 22842, filed in 2021:
Average Adjusted Gross Income (AGI) in 2020: $56,076 (Individual Income Tax Returns)
Here:
$56,076
State:
$86,446
Salary/wage: $46,187 (reported on 83.3% of returns)
Here:
$46,187
State:
$71,185
(% of AGI for various income ranges: 1173.4% for AGIs below $25k, 3920.4% for AGIs $25k-50k, 6384.2% for AGIs $50k-75k, 8834.7% for AGIs $75k-100k, 12453.1% for AGIs $100k-200k)
Taxable interest for individuals: $1,765 (reported on 25.8% of returns)
This zip code:
$1,765
Virginia:
$1,805
(% of AGI for various income ranges: 21.8% for AGIs below $25k, 29.1% for AGIs $25k-50k, 42.4% for AGIs $50k-75k, 54.7% for AGIs $75k-100k, 160.0% for AGIs $100k-200k)
Ordinary dividends: $4,100 (reported on 19.8% of returns)
Here:
$4,100
State:
$8,327
(% of AGI for various income ranges: 26.4% for AGIs below $25k, 37.2% for AGIs $25k-50k, 116.7% for AGIs $50k-75k, 111.2% for AGIs $75k-100k, 420.0% for AGIs $100k-200k)
Net capital gain/loss in AGI: +$17,746 (reported on 15.5% of returns)
Here:
+$17,746
State:
+$24,644
(% of AGI for various income ranges: 14.6% for AGIs below $25k, 36.5% for AGIs $25k-50k, 82.1% for AGIs $50k-75k, 204.1% for AGIs $75k-100k, 920.6% for AGIs $100k-200k)
Profit/loss from business: +$17,235 (reported on 13.5% of returns)
Here:
+$17,235
State:
+$12,836
(% of AGI for various income ranges: 116.1% for AGIs below $25k, 109.5% for AGIs $25k-50k, 131.5% for AGIs $50k-75k, 135.3% for AGIs $75k-100k, 2415.0% for AGIs $100k-200k)
Taxable individual retirement arrangement distribution: $16,850 (reported on 10.3% of returns)
22842:
$16,850
Virginia:
$21,535
(% of AGI for various income ranges: 60.7% for AGIs below $25k, 73.9% for AGIs $25k-50k, 192.1% for AGIs $50k-75k, 362.9% for AGIs $75k-100k, 1461.9% for AGIs $100k-200k)
Total itemized deductions: $37,054 (reported on 5.2% of returns)
Here:
$37,054
State:
$33,287
(% of AGI for various income ranges: 70.8% for AGIs below $25k, 268.8% for AGIs $50k-75k, 1016.9% for AGIs $100k-200k)
Charity contributions: $15,191 (reported on 4.4% of returns)
Here:
$15,191
State:
$10,381
(% of AGI for various income ranges: 55.8% for AGIs $50k-75k, 349.4% for AGIs $100k-200k)
Taxes paid: $6,946 (reported on 5.2% of returns)
22842:
$6,946
State:
$8,284
(% of AGI for various income ranges: 73.3% for AGIs $50k-75k, 263.1% for AGIs $100k-200k)
Earned income credit: $2,151 (reported on 17.9% of returns)
Here:
$2,151
State:
$2,214
(% of AGI for various income ranges: 93.9% for AGIs below $25k, 69.3% for AGIs $25k-50k)
Percentage of individuals using paid preparers for their 2020 taxes: 94.0%
Here:
94%
State:
92%
(% for various income ranges: 92.6% for AGIs below $25k, 94.5% for AGIs $25k-50k, 93.0% for AGIs $50k-75k, 95.8% for AGIs $75k-100k, 96.0% for AGIs $100k-200k, 100.0% for AGIs over 200k)
Averages for the 2012 tax year for zip code 22842, filed in 2013:
Average Adjusted Gross Income (AGI) in 2012: $44,097 (Individual Income Tax Returns)
Here:
$44,097
State:
$71,192
Salary/wage: $36,303 (reported on 86.7% of returns)
Here:
$36,303
State:
$59,229
(% of AGI for various income ranges: 80.3% for AGIs below $25k, 83.3% for AGIs $25k-50k, 76.0% for AGIs $50k-75k, 72.6% for AGIs $75k-100k, 61.6% for AGIs $100k-200k, 42.0% for AGIs over 200k)
Taxable interest for individuals: $2,026 (reported on 30.2% of returns)
This zip code:
$2,026
Virginia:
$1,600
(% of AGI for various income ranges: 1.1% for AGIs below $25k, 0.8% for AGIs $25k-50k, 1.6% for AGIs $50k-75k, 1.6% for AGIs $75k-100k, 1.4% for AGIs $100k-200k, 2.2% for AGIs over 200k)
Ordinary dividends: $2,780 (reported on 22.2% of returns)
Here:
$2,780
State:
$6,959
(% of AGI for various income ranges: 1.4% for AGIs below $25k, 0.7% for AGIs $25k-50k, 1.3% for AGIs $50k-75k, 2.0% for AGIs $75k-100k, 2.7% for AGIs $100k-200k)
Net capital gain/loss in AGI: +$9,116 (reported on 11.1% of returns)
Here:
+$9,116
State:
+$16,672
(% of AGI for various income ranges: 0.7% for AGIs $25k-50k, 1.1% for AGIs $50k-75k, 2.0% for AGIs $75k-100k, 9.0% for AGIs $100k-200k)
Profit/loss from business: +$10,113 (reported on 13.3% of returns)
Here:
+$10,113
State:
+$14,116
(% of AGI for various income ranges: 5.9% for AGIs below $25k, 3.0% for AGIs $25k-50k, 3.3% for AGIs $50k-75k, 1.4% for AGIs $75k-100k, 4.1% for AGIs $100k-200k)
Taxable individual retirement arrangement distribution: $11,108 (reported on 10.7% of returns)
22842:
$11,108
Virginia:
$16,667
(% of AGI for various income ranges: 2.6% for AGIs below $25k, 1.6% for AGIs $25k-50k, 2.2% for AGIs $50k-75k, 2.4% for AGIs $75k-100k, 6.5% for AGIs $100k-200k)
Total itemized deductions: $19,013 (24% of AGI, reported on 27.6% of returns)
Here:
$19,013
State:
$26,596
Here:
23.8% of AGI
State:
20.1% of AGI
(% of AGI for various income ranges: 8.2% for AGIs below $25k, 10.6% for AGIs $25k-50k, 11.7% for AGIs $50k-75k, 12.4% for AGIs $75k-100k, 14.2% for AGIs $100k-200k, 14.5% for AGIs over 200k)
Charity contributions: $3,256 (reported on 20.0% of returns)
Here:
$3,256
State:
$4,443
(% of AGI for various income ranges: 0.5% for AGIs below $25k, 0.9% for AGIs $25k-50k, 1.4% for AGIs $50k-75k, 1.9% for AGIs $75k-100k, 2.1% for AGIs $100k-200k, 2.4% for AGIs over 200k)
Taxes paid: $5,338 (reported on 27.1% of returns)
22842:
$5,338
State:
$9,951
(% of AGI for various income ranges: 1.1% for AGIs below $25k, 1.8% for AGIs $25k-50k, 2.6% for AGIs $50k-75k, 3.6% for AGIs $75k-100k, 5.2% for AGIs $100k-200k, 6.5% for AGIs over 200k)
Earned income credit: $2,119 (reported on 21.3% of returns)
Here:
$2,119
State:
$2,211
(% of AGI for various income ranges: 5.9% for AGIs below $25k, 1.3% for AGIs $25k-50k)
Percentage of individuals using paid preparers for their 2012 taxes: 56.0%
Here:
56%
State:
46%
(% for various income ranges: 50.0% for AGIs below $25k, 57.4% for AGIs $25k-50k, 64.7% for AGIs $50k-75k, 57.9% for AGIs $75k-100k, 78.6% for AGIs $100k-200k)
Averages for the 2004 tax year for zip code 22842, filed in 2005:
Average Adjusted Gross Income (AGI) in 2004: $36,256 (Individual Income Tax Returns)
Here:
$36,256
State:
$56,704
Salary/wage: $31,331 (reported on 86.1% of returns)
Here:
$31,331
State:
$48,441
(% of AGI for various income ranges: 84.0% for AGIs below $10k, 80.8% for AGIs $10k-25k, 85.0% for AGIs $25k-50k, 79.3% for AGIs $50k-75k, 72.6% for AGIs $75k-100k, 46.5% for AGIs over 100k)
Taxable interest for individuals: $1,727 (reported on 39.4% of returns)
This zip code:
$1,727
Virginia:
$1,688
(% of AGI for various income ranges: 6.6% for AGIs below $10k, 2.0% for AGIs $10k-25k, 1.3% for AGIs $25k-50k, 1.5% for AGIs $50k-75k, 1.9% for AGIs $75k-100k, 2.5% for AGIs over 100k)
Taxable dividends: $2,671 (reported on 22.2% of returns)
Here:
$2,671
State:
$4,028
(% of AGI for various income ranges: 3.6% for AGIs below $10k, 1.4% for AGIs $10k-25k, 0.6% for AGIs $25k-50k, 1.8% for AGIs $50k-75k, 1.9% for AGIs $75k-100k, 2.9% for AGIs over 100k)
Net capital gain/loss: +$13,124 (reported on 14.0% of returns)
Here:
+$13,124
State:
+$14,375
(% of AGI for various income ranges: 0.6% for AGIs below $10k, 0.8% for AGIs $10k-25k, 0.9% for AGIs $25k-50k, 1.6% for AGIs $50k-75k, 3.7% for AGIs $75k-100k, 20.4% for AGIs over 100k)
Profit/loss from business: +$8,958 (reported on 15.1% of returns)
Here:
+$8,958
State:
+$13,342
(% of AGI for various income ranges: 7.4% for AGIs below $10k, 6.2% for AGIs $10k-25k, 2.6% for AGIs $25k-50k, 3.4% for AGIs $50k-75k, -0.2% for AGIs $75k-100k, 6.4% for AGIs over 100k)
IRA payment deduction: $3,076 (reported on 3.0% of returns)
22842:
$3,076
Virginia:
$2,943
(% of AGI for various income ranges: 0.2% for AGIs $10k-25k, 0.3% for AGIs $25k-50k, 0.3% for AGIs $50k-75k, 0.5% for AGIs $75k-100k)
Total itemized deductions: $15,582 (23% of AGI, reported on 24.3% of returns)
Here:
$15,582
State:
$21,492
Here:
23.3% of AGI
State:
21.0% of AGI
(% of AGI for various income ranges: 10.1% for AGIs below $10k, 6.9% for AGIs $10k-25k, 9.0% for AGIs $25k-50k, 12.4% for AGIs $50k-75k, 14.1% for AGIs $75k-100k, 10.8% for AGIs over 100k)
Charity contributions deductions: $2,752 (4% of AGI, reported on 19.1% of returns)
Here:
$2,752
State:
$3,794
Here:
3.8% of AGI
State:
3.5% of AGI
(% of AGI for various income ranges: 0.4% for AGIs below $10k, 0.7% for AGIs $10k-25k, 0.9% for AGIs $25k-50k, 1.4% for AGIs $50k-75k, 2.1% for AGIs $75k-100k, 2.6% for AGIs over 100k)
Total tax: $4,485 (reported on 75.2% of returns)
22842:
$4,485
State:
$9,537
(% of AGI for various income ranges: 3.1% for AGIs below $10k, 4.3% for AGIs $10k-25k, 6.8% for AGIs $25k-50k, 8.8% for AGIs $50k-75k, 10.4% for AGIs $75k-100k, 17.7% for AGIs over 100k)
Earned income credit: $1,767 (reported on 16.1% of returns)
Here:
$1,767
State:
$1,734
Percentage of individuals using paid preparers for their 2004 taxes: 56.6%
Here:
57%
State:
52%
(% for various income ranges: 50.0% for AGIs below $10k, 53.8% for AGIs $10k-25k, 59.3% for AGIs $25k-50k, 58.6% for AGIs $50k-75k, 63.0% for AGIs $75k-100k, 72.0% for AGIs over 100k)
Likely homosexual households (counted as self-reported same-sex unmarried-partner households)
Lesbian couples: 0.2% of all households
Gay men: 0.0% of all households
Household received Food Stamps/SNAP in the past 12 months: 288 Household did not receive Food Stamps/SNAP in the past 12 months: 1,830
Women who had a birth in the past 12 months: 104 (100 now married, 6 unmarried) Women who did not have a birth in the past 12 months: 965 (390 now married, 575 unmarried)
Housing units in zip code 22842 with a mortgage: 786 (130 second mortgage, 107 both second mortgage and home equity loan) Houses without a mortgage: 23
Median monthly owner costs for units with a mortgage: $1,444 Median monthly owner costs for units without a mortgage: $356
Residents with income below the poverty level in 2022:
This zip code:
16.0%
Whole state:
10.6%
Residents with income below 50% of the poverty level in 2022:
This zip code:
7.9%
Whole state:
5.2%
Median number of rooms in houses and condos:
Here:
6.2
State:
7.0
Median number of rooms in apartments:
Here:
4.8
State:
4.3
Notable locations in this zip code not listed on our city pages
Churches in zip code 22842 include: Christ Church (A), Grace Church (B), Mount Calvary Lutheran Church (C), Morning Star Church (D), Mount Hermon Church (E), Otterbein Chapel (F), Saint Andrews Church (G), Saint Jacobs Church (H), Saint Lukes Church (I). Display/hide their locations on the map
Cemeteries: Saint Marks Cemetery (1), Our Soldiers Cemetery (2), Saint Marys Cemetery (3), Saint Lukes Cemetery (4), Mount Hermon Cemetery (5), Morning Star Cemetery (6), Grace Cemetery (7). Display/hide their locations on the map
In group quarters: 29 (-1 institutionalized population)
Size of family households: 663 2-persons, 261 3-persons, 292 4-persons, 110 5-persons, 8 6-persons, 68 7-or-more-persons
Size of nonfamily households: 576 1-person, 122 2-persons
559 married couples with children.
378 single-parent households (72 men, 306 women).
88.1% of residents of 22842 zip code speak English at home.
10.3% of residents speak Spanish at home (60% very well, 15% well, 17% not well, 8% not at all).
1.2% of residents speak other Indo-European language at home (41% very well, 58% well, 2% not well).
0.1% of residents speak Asian or Pacific Island language at home (100% well).
0.1% of residents speak other language at home (100% well).
Foreign born population: 401 (7.1%) (30.2% of them are naturalized citizens)
This zip code:
7.1%
Whole state:
12.7%
37%Honduras
30%Costa Rica
6%Serbia
5%El Salvador
3%Latvia
2%Japan
1%Mexico
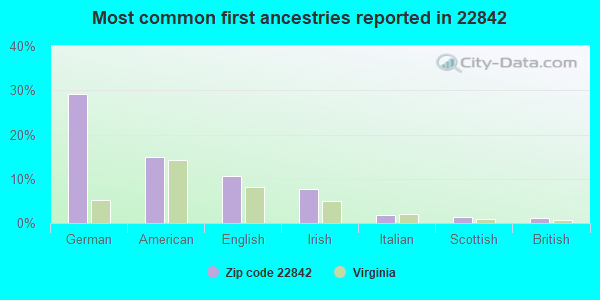
29%German
15%American
11%English
8%Irish
2%Italian
1%Scottish
1%British
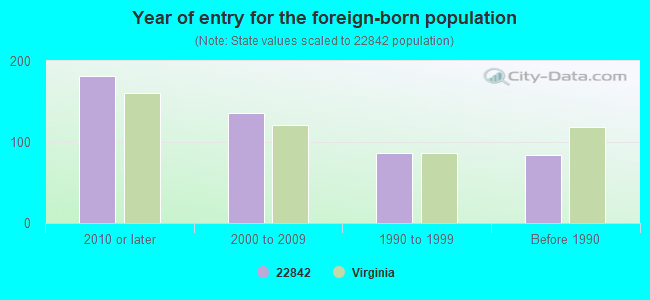
Year of entry for the foreign-born population
1812010 or later
1362000 to 2009
861990 to 1999
84Before 1990
Facilities with environmental interests located in this zip code:
BOWMAN APPLE PRODUCTS - MOUNT JACKSON (10119 OLD VALLEY PIKE in MOUNT JACKSON, VA)
AIR SYNTHETIC MINOR (AIRS/AFS) STATE MASTER (Virginia pollutants databases) - CEDS-80115, AIR PROGRAM CRITERIA AND HAZARDOUS AIR POLLUTANT INVENTORY (Inventory of air pollution sources) National Pollutant Discharge Elimination System NON-MAJOR (Tracking pollutant discharge elimination systems) - permit Business SIC classification: CANNED FRUITS, VEGETABLES, PRESERVES, JAMS, AND JELLIES; PICKLED FRUITS AND VEGETABLES, VEGETABLE SAUCES AND SEASONINGS, AND SALAD DRESSINGS; FOOD PREPARATIONS Business NAICS classification: FRUIT AND VEGETABLE CANNING.; FRUIT AND VEGETABLE CANNING. Alternative names: BOWMAN APPLE-MOUNT JACKSON, BOWMAN APPLE PRODUCTS COMPANY INCORPORATED
7-ELEVEN #17710 (5335 NORTH MAIN STREET in MOUNT JACKSON, VA)
Small Quantity Generators, between 100 kg and 1000 kg of hazardous waste/month (Resource Conservation and Recovery Act (tracking hazardous waste)) - notification Organizations: OPERNAME (CONTACT/OPERATOR)
, SOUTHLAND CORPORATION THE (CONTACT/OWNER)
CHARLES FANSLER - FARM (126 CREEK LANE in MT JACKSON, VA)
AIR MINOR (AIRS/AFS) Business SIC classification: CHICKEN EGGS
Housing units lacking complete plumbing facilities: 3.2% Housing units lacking complete kitchen facilities: 2.5%
58.8%Electricity
14.2%Fuel oil, kerosene, etc.
11.7%Bottled, tank, or LP gas
8.8%Wood
3.6%Other fuel
2.2%Utility gas
0.8%No fuel used
Population in 1990: 4,601.
Place of birth for U.S.-born residents:
This state: 3,854
Northeast: 456
Midwest: 110
South: 658
West: 97
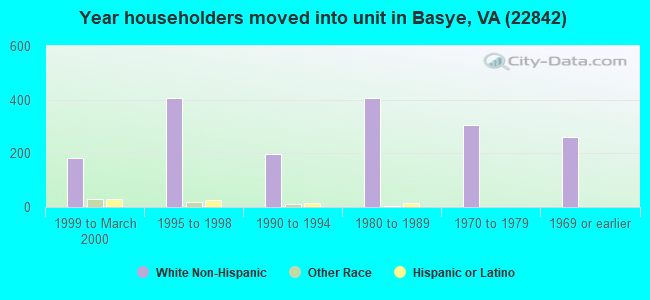
64% of the 22842 zip code residents lived in the same house 5 years ago. Out of people who lived in different houses, 61% lived in this county. Out of people who lived in different counties, 50% lived in Virginia.
90% of the 22842 zip code residents lived in the same house 1 year ago. Out of people who lived in different houses, 57% moved from this county. Out of people who lived in different houses, 16% moved from different county within same state. Out of people who lived in different houses, 24% moved from different state. Out of people who lived in different houses, 1% moved from abroad.
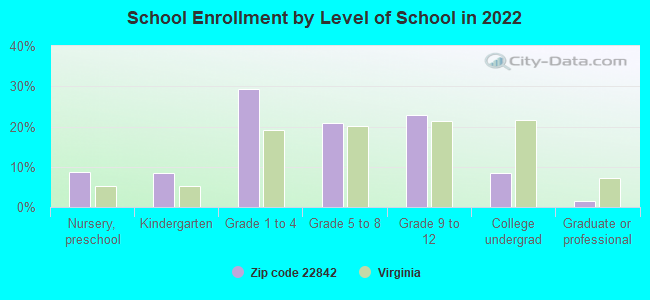
Private vs. public school enrollment:
Students in private schools in grades 1 to 8 (elementary and middle school): 72
Here:
13.2%
Virginia:
13.2%
Students in private schools in grades 9 to 12 (high school):
Here:
0.0%
Virginia:
10.2%
Students in private undergraduate colleges: 11
Here:
13.0%
Virginia:
18.7%
Occupation by median earnings in the past 12 months ($)
110,312Transportation occupations
83,591Health diagnosing and treating practitioners and other technical occupations
65,823Management occupations
64,920Business and financial operations occupations
55,628Computer and mathematical occupations
46,230Construction and extraction occupations
Companies with federal contracts located in this zip code:
HOLTZMAN OIL CORP (5534 MAIN ST in MOUNT JACKSON, VA; small business) : $848,051 in 14 contractsfrom 2002 to 2006
Contracts for Liquid Propellants and Fuels, Petroleum Base, Gases: Compressed and Liquefied, Fueling and Other Petroleum Services - Excluding Storage, Fuel Oils by Defense Logistics Agency, National Park Service Signed by year:2000: $0; 2001: $0; 2002: $342,925; 2003: $0; 2004: $163,892; 2005: $40,000; 2006: $301,234.
Biggest contracts:
$342,925 with Defense Logistics Agency for Liquid Propellants and Fuels, Petroleum Base. Signed on 2002-07-29. Completion date: 2005-07-31.
$209,000 with National Park Service for Gases: Compressed and Liquefied. Signed on 2006-01-05. Completion date: 2006-09-30.
$120,530 with National Park Service for Fueling and Other Petroleum Services - Excluding Storage. Taking place in DC. Signed on 2004-03-09. Completion date: 2004-09-30.
$40,000 with National Park Service for Fuel Oils. Taking place in MD. Signed on 2005-12-12. Completion date: 2006-09-30.
Top industries in this zip code by the number of employees in 2005:
Wholesale Trade: Petroleum and Petroleum Products Merchant Wholesalers (except Bulk Stations and Terminals) (50-99 employees: 1 establishment)
Accommodation and Food Services: Limited-Service Restaurants (20-49: 2, 1-4: 1)
Construction: New Single-Family Housing Construction (except Operative Builders) (10-19: 1, 5-9: 2, 1-4: 4)
Accommodation and Food Services: Full-Service Restaurants (20-49: 1, 1-4: 1)
23 people in workers' group living quarters and job corps centers
6 people in group homes intended for adults
People in group quarters in 2000:
4 people in homes or halfway houses for drug/alcohol abuse
Fatal accident statistics in 2014:
Fatal accident count: 1
Vehicles involved in fatal accidents: 3
Fatal accidents caused by drunken drivers: 0
Fatalities: 1
Persons involved in fatal accidents: 3
Pedestrians involved in fatal accidents: 0
Fatal accident statistics in 2013:
Fatal accident count: 1
Vehicles involved in fatal accidents: 1
Fatal accidents caused by drunken drivers: 1
Fatalities: 1
Persons involved in fatal accidents: 1
Pedestrians involved in fatal accidents: 0
2002 - 2018 National Fire Incident Reporting System (NFIRS) incidents
Based on the data from the years 2002 - 2018 the average number of fires per year is 28. The highest number of fires - 56 took place in 2014, and the least - 9 in 2010. The data has a rising trend.
When looking into fire subcategories, the most incidents belonged to: Structure Fires (53.8%), and Outside Fires (23.4%).
Fire incident types reported to NFIRS in Zip Code 22842


 Nearest zip codes: 22847, 22824, 22810, 22845, 22844, 22853.


 Based on the data from the years 2002 - 2018 the average number of fires per year is 28. The highest number of fires - 56 took place in 2014, and the least - 9 in 2010. The data has a rising trend.
 When looking into fire subcategories, the most incidents belonged to: Structure Fires (53.8%), and Outside Fires (23.4%).