Estimated zip code population in 2022: 4,743 Zip code population in 2010: 4,528 Zip code population in 2000: 3,987
Houses and condos: 2,324 Renter-occupied apartments: 775
% of renters here:
36%
State:
33%
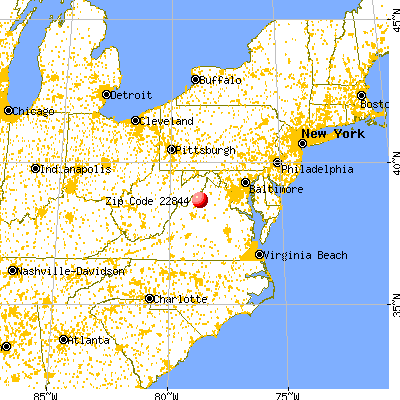
March 2022 cost of living index in zip code 22844: 85.6 (less than average, U.S. average is 100)
Land area: 48.5 sq. mi. Water area: 0.3 sq. mi.
Population density: 98 people per square mile
(very low).
OSM Map
General Map
Google Map
MSN Map
OSM Map
General Map
Google Map
MSN Map
OSM Map
General Map
Google Map
MSN Map
OSM Map
General Map
Google Map
MSN Map
Please wait while loading the map...
Real estate property taxes paid for housing units in 2022:
This zip code:
0.5% ($1,497)
Virginia:
0.7% ($2,617)
Median real estate property taxes paid for housing units with mortgages in 2022: $1,518 (0.6%) Median real estate property taxes paid for housing units with no mortgage in 2022: $1,511 (0.5%)
Business Search- 14 Million verified businesses
Males: 2,229
(47.0%)
Females: 2,513
(53.0%)
For population 25 years and over in 22844:
High school or higher: 89.1%
Bachelor's degree or higher: 19.6%
Graduate or professional degree: 10.2%
Unemployed: 4.5%
Mean travel time to work (commute): 22.3 minutes
For population 15 years and over in 22844:
Never married: 24.6%
Now married: 47.6%
Separated: 0.9%
Widowed: 10.3%
Divorced: 16.6%
Zip code 22844 compared to state average:
Median household income below state average.
Black race population percentage significantly below state average.
Hispanic race population percentage below state average.
Median age significantly above state average.
Foreign-born population percentage significantly below state average.
Length of stay since moving in significantly above state average.
Number of college students below state average.
Percentage of population with a bachelor's degree or higher below state average.
Estimated median house/condo value in 2022: $278,634
22844:
$278,634
Virginia:
$365,700
According to our research of Virginia and other state lists, there were 11 registered sex offenders living in 22844 zip code as of June 16, 2024. The ratio of all residents to sex offenders in zip code 22844 is 421 to 1. The ratio of registered sex offenders to all residents in this zip code is lower than the state average.
Median resident age:
This zip code:
54.7 years
Virginia median age:
39.0 years
Average household size:
This zip code:
2.1 people
Virginia:
2.5 people
Averages for the 2020 tax year for zip code 22844, filed in 2021:
Average Adjusted Gross Income (AGI) in 2020: $58,144 (Individual Income Tax Returns)
Here:
$58,144
State:
$86,446
Salary/wage: $47,961 (reported on 78.4% of returns)
Here:
$47,961
State:
$71,185
(% of AGI for various income ranges: 1146.8% for AGIs below $25k, 3758.5% for AGIs $25k-50k, 6389.5% for AGIs $50k-75k, 10037.9% for AGIs $75k-100k, 14875.0% for AGIs $100k-200k, 53870.0% for AGIs over 200k)
Taxable interest for individuals: $1,525 (reported on 32.9% of returns)
This zip code:
$1,525
Virginia:
$1,805
(% of AGI for various income ranges: 17.0% for AGIs below $25k, 50.9% for AGIs $25k-50k, 94.5% for AGIs $50k-75k, 112.1% for AGIs $75k-100k, 220.0% for AGIs $100k-200k, 555.0% for AGIs over 200k)
Ordinary dividends: $6,071 (reported on 22.1% of returns)
Here:
$6,071
State:
$8,327
(% of AGI for various income ranges: 28.7% for AGIs below $25k, 66.0% for AGIs $25k-50k, 157.3% for AGIs $50k-75k, 183.6% for AGIs $75k-100k, 837.9% for AGIs $100k-200k, 3685.0% for AGIs over 200k)
Net capital gain/loss in AGI: +$20,605 (reported on 17.6% of returns)
Here:
+$20,605
State:
+$24,644
(% of AGI for various income ranges: 33.0% for AGIs below $25k, 60.6% for AGIs $25k-50k, 135.9% for AGIs $50k-75k, 348.6% for AGIs $75k-100k, 1335.0% for AGIs $100k-200k, 24600.0% for AGIs over 200k)
Profit/loss from business: +$12,529 (reported on 14.0% of returns)
Here:
+$12,529
State:
+$12,836
(% of AGI for various income ranges: 107.9% for AGIs below $25k, 91.7% for AGIs $25k-50k, 422.3% for AGIs $50k-75k, 351.4% for AGIs $75k-100k, 1042.9% for AGIs $100k-200k)
Taxable individual retirement arrangement distribution: $13,756 (reported on 11.3% of returns)
22844:
$13,756
Virginia:
$21,535
(% of AGI for various income ranges: 57.9% for AGIs below $25k, 112.8% for AGIs $25k-50k, 291.4% for AGIs $50k-75k, 295.7% for AGIs $75k-100k, 1105.0% for AGIs $100k-200k)
Total itemized deductions: $32,559 (reported on 7.7% of returns)
Here:
$32,559
State:
$33,287
(% of AGI for various income ranges: 159.1% for AGIs $25k-50k, 648.6% for AGIs $50k-75k, 1343.6% for AGIs $100k-200k, 7395.0% for AGIs over 200k)
Charity contributions: $13,279 (reported on 6.3% of returns)
Here:
$13,279
State:
$10,381
(% of AGI for various income ranges: 17.2% for AGIs below $25k, 217.3% for AGIs $50k-75k, 377.9% for AGIs $100k-200k, 3805.0% for AGIs over 200k)
Taxes paid: $6,494 (reported on 7.7% of returns)
22844:
$6,494
State:
$8,284
(% of AGI for various income ranges: 24.0% for AGIs $25k-50k, 117.3% for AGIs $50k-75k, 333.6% for AGIs $100k-200k, 1330.0% for AGIs over 200k)
Earned income credit: $2,089 (reported on 15.8% of returns)
Here:
$2,089
State:
$2,214
(% of AGI for various income ranges: 81.1% for AGIs below $25k, 64.0% for AGIs $25k-50k)
Percentage of individuals using paid preparers for their 2020 taxes: 92.8%
Here:
93%
State:
92%
(% for various income ranges: 91.7% for AGIs below $25k, 91.9% for AGIs $25k-50k, 91.2% for AGIs $50k-75k, 95.5% for AGIs $75k-100k, 96.2% for AGIs $100k-200k, 100.0% for AGIs over 200k)
Averages for the 2012 tax year for zip code 22844, filed in 2013:
Average Adjusted Gross Income (AGI) in 2012: $44,319 (Individual Income Tax Returns)
Here:
$44,319
State:
$71,192
Salary/wage: $37,031 (reported on 83.0% of returns)
Here:
$37,031
State:
$59,229
(% of AGI for various income ranges: 76.8% for AGIs below $25k, 78.3% for AGIs $25k-50k, 70.7% for AGIs $50k-75k, 70.6% for AGIs $75k-100k, 62.1% for AGIs $100k-200k, 55.7% for AGIs over 200k)
Taxable interest for individuals: $1,612 (reported on 35.4% of returns)
This zip code:
$1,612
Virginia:
$1,600
(% of AGI for various income ranges: 2.0% for AGIs below $25k, 0.9% for AGIs $25k-50k, 1.4% for AGIs $50k-75k, 1.2% for AGIs $75k-100k, 1.6% for AGIs $100k-200k, 0.5% for AGIs over 200k)
Ordinary dividends: $4,265 (reported on 22.3% of returns)
Here:
$4,265
State:
$6,959
(% of AGI for various income ranges: 1.7% for AGIs below $25k, 1.2% for AGIs $25k-50k, 1.8% for AGIs $50k-75k, 2.0% for AGIs $75k-100k, 4.3% for AGIs $100k-200k)
Net capital gain/loss in AGI: +$4,034 (reported on 15.5% of returns)
Here:
+$4,034
State:
+$16,672
(% of AGI for various income ranges: 0.2% for AGIs $50k-75k, 2.0% for AGIs $75k-100k, 4.4% for AGIs $100k-200k)
Profit/loss from business: +$7,503 (reported on 14.6% of returns)
Here:
+$7,503
State:
+$14,116
(% of AGI for various income ranges: 5.5% for AGIs below $25k, 2.3% for AGIs $25k-50k, 3.3% for AGIs $50k-75k, 1.3% for AGIs $75k-100k, 2.2% for AGIs $100k-200k)
Taxable individual retirement arrangement distribution: $11,739 (reported on 11.2% of returns)
22844:
$11,739
Virginia:
$16,667
(% of AGI for various income ranges: 2.6% for AGIs below $25k, 2.2% for AGIs $25k-50k, 2.5% for AGIs $50k-75k, 3.1% for AGIs $75k-100k, 5.3% for AGIs $100k-200k)
Total itemized deductions: $20,331 (25% of AGI, reported on 30.1% of returns)
Here:
$20,331
State:
$26,596
Here:
25.2% of AGI
State:
20.1% of AGI
(% of AGI for various income ranges: 10.7% for AGIs below $25k, 11.5% for AGIs $25k-50k, 13.0% for AGIs $50k-75k, 15.4% for AGIs $75k-100k, 15.8% for AGIs $100k-200k, 16.2% for AGIs over 200k)
Charity contributions: $4,571 (reported on 23.8% of returns)
Here:
$4,571
State:
$4,443
(% of AGI for various income ranges: 1.0% for AGIs below $25k, 1.1% for AGIs $25k-50k, 1.8% for AGIs $50k-75k, 3.0% for AGIs $75k-100k, 3.5% for AGIs $100k-200k, 4.8% for AGIs over 200k)
Taxes paid: $5,232 (reported on 30.1% of returns)
22844:
$5,232
State:
$9,951
(% of AGI for various income ranges: 1.1% for AGIs below $25k, 1.9% for AGIs $25k-50k, 2.8% for AGIs $50k-75k, 4.0% for AGIs $75k-100k, 5.3% for AGIs $100k-200k, 6.5% for AGIs over 200k)
Earned income credit: $1,788 (reported on 19.9% of returns)
Here:
$1,788
State:
$2,211
(% of AGI for various income ranges: 5.2% for AGIs below $25k, 1.0% for AGIs $25k-50k)
Percentage of individuals using paid preparers for their 2012 taxes: 57.8%
Here:
58%
State:
46%
(% for various income ranges: 55.1% for AGIs below $25k, 58.8% for AGIs $25k-50k, 62.1% for AGIs $50k-75k, 52.9% for AGIs $75k-100k, 58.8% for AGIs $100k-200k, 100.0% for AGIs over 200k)
Averages for the 2004 tax year for zip code 22844, filed in 2005:
Average Adjusted Gross Income (AGI) in 2004: $40,460 (Individual Income Tax Returns)
Here:
$40,460
State:
$56,704
Salary/wage: $33,653 (reported on 82.0% of returns)
Here:
$33,653
State:
$48,441
(% of AGI for various income ranges: 112.1% for AGIs below $10k, 74.1% for AGIs $10k-25k, 75.7% for AGIs $25k-50k, 73.2% for AGIs $50k-75k, 74.3% for AGIs $75k-100k, 47.7% for AGIs over 100k)
Taxable interest for individuals: $1,615 (reported on 49.0% of returns)
This zip code:
$1,615
Virginia:
$1,688
(% of AGI for various income ranges: 6.3% for AGIs below $10k, 3.1% for AGIs $10k-25k, 1.9% for AGIs $25k-50k, 1.2% for AGIs $50k-75k, 2.0% for AGIs $75k-100k, 1.8% for AGIs over 100k)
Taxable dividends: $2,625 (reported on 28.0% of returns)
Here:
$2,625
State:
$4,028
(% of AGI for various income ranges: 5.6% for AGIs below $10k, 2.4% for AGIs $10k-25k, 1.4% for AGIs $25k-50k, 1.3% for AGIs $50k-75k, 2.0% for AGIs $75k-100k, 2.1% for AGIs over 100k)
Net capital gain/loss: +$10,995 (reported on 20.5% of returns)
Here:
+$10,995
State:
+$14,375
(% of AGI for various income ranges: 5.4% for AGIs below $10k, 0.3% for AGIs $10k-25k, 0.9% for AGIs $25k-50k, 1.0% for AGIs $50k-75k, 3.8% for AGIs $75k-100k, 17.1% for AGIs over 100k)
Profit/loss from business: +$12,820 (reported on 16.1% of returns)
Here:
+$12,820
State:
+$13,342
(% of AGI for various income ranges: 4.4% for AGIs below $10k, 4.7% for AGIs $10k-25k, 5.0% for AGIs $25k-50k, 3.5% for AGIs $50k-75k, 3.4% for AGIs $75k-100k, 7.7% for AGIs over 100k)
IRA payment deduction: $3,393 (reported on 3.1% of returns)
22844:
$3,393
Virginia:
$2,943
(% of AGI for various income ranges: 0.3% for AGIs $10k-25k, 0.3% for AGIs $25k-50k, 0.4% for AGIs $50k-75k, 0.2% for AGIs over 100k)
Total itemized deductions: $16,933 (24% of AGI, reported on 29.5% of returns)
Here:
$16,933
State:
$21,492
Here:
23.5% of AGI
State:
21.0% of AGI
(% of AGI for various income ranges: 21.7% for AGIs below $10k, 10.1% for AGIs $10k-25k, 10.1% for AGIs $25k-50k, 12.9% for AGIs $50k-75k, 15.2% for AGIs $75k-100k, 12.7% for AGIs over 100k)
Charity contributions deductions: $4,034 (5% of AGI, reported on 25.2% of returns)
Here:
$4,034
State:
$3,794
Here:
5.3% of AGI
State:
3.5% of AGI
(% of AGI for various income ranges: 1.4% for AGIs below $10k, 1.5% for AGIs $10k-25k, 1.7% for AGIs $25k-50k, 2.6% for AGIs $50k-75k, 3.1% for AGIs $75k-100k, 3.4% for AGIs over 100k)
Total tax: $5,269 (reported on 76.8% of returns)
22844:
$5,269
State:
$9,537
(% of AGI for various income ranges: 2.9% for AGIs below $10k, 4.1% for AGIs $10k-25k, 6.8% for AGIs $25k-50k, 8.9% for AGIs $50k-75k, 10.7% for AGIs $75k-100k, 16.6% for AGIs over 100k)
Earned income credit: $1,686 (reported on 14.6% of returns)
Here:
$1,686
State:
$1,734
Percentage of individuals using paid preparers for their 2004 taxes: 63.3%
Here:
63%
State:
52%
(% for various income ranges: 54.5% for AGIs below $10k, 61.2% for AGIs $10k-25k, 64.0% for AGIs $25k-50k, 68.6% for AGIs $50k-75k, 67.6% for AGIs $75k-100k, 77.3% for AGIs over 100k)
Likely homosexual households (counted as self-reported same-sex unmarried-partner households)
Lesbian couples: 0.0% of all households
Gay men: 0.3% of all households
Household received Food Stamps/SNAP in the past 12 months: 289 Household did not receive Food Stamps/SNAP in the past 12 months: 1,882
Women who had a birth in the past 12 months: 7 (0 now married, 6 unmarried) Women who did not have a birth in the past 12 months: 801 (346 now married, 454 unmarried)
Housing units in zip code 22844 with a mortgage: 761 (39 second mortgage, 18 both second mortgage and home equity loan) Houses without a mortgage: 109
Median monthly owner costs for units with a mortgage: $1,366 Median monthly owner costs for units without a mortgage: $375
Residents with income below the poverty level in 2022:
This zip code:
12.0%
Whole state:
10.6%
Residents with income below 50% of the poverty level in 2022:
This zip code:
10.0%
Whole state:
5.2%
Median number of rooms in houses and condos:
Here:
7.0
State:
7.0
Median number of rooms in apartments:
Here:
4.2
State:
4.3
Notable locations in this zip code not listed on our city pages
Notable locations in zip code 22844: Moores Store (A), New Market Battlefield (B), New Market Station (C), Endless Caverns (D), Endless Caverns Campgrounds (E), Bushong Farm (F), Shenvalee Golf Resort (G), Cedar Bluff Dairy (H), New Market Battlefield Military Museum (I), New Market Area Public Library (J), Museum of American Calvary (K), Hall of Valor Civil War Museum (L). Display/hide their locations on the map
Churches in zip code 22844 include: Cedar Grove Church (A), Mount Zion Church (B), Saint Martins Church (C), Valley Central Church (D), Woods Chapel (E), Apostolic Lighthouse Tabernacle (F), New Market United Methodist Church (G), Reformation Lutheran Church (H), Smiths Creek Baptist Church (I). Display/hide their locations on the map
Cemeteries: Woods Chapel Cemetery (1), Valley Central Cemetery (2), Reformation Cemetery (3), Mount Zion Cemetery (4), Cedar Grove Cemetery (5). Display/hide their locations on the map
In group quarters: 143 (-1 institutionalized population)
Size of family households: 646 2-persons, 248 3-persons, 155 4-persons, 56 5-persons, 52 6-persons
Size of nonfamily households: 846 1-person, 162 2-persons
353 married couples with children.
141 single-parent households (141 women).
95.5% of residents of 22844 zip code speak English at home.
3.2% of residents speak Spanish at home (90% very well, 2% well, 8% not well).
1.6% of residents speak other Indo-European language at home (68% very well, 10% well, 22% not well).
0.3% of residents speak Asian or Pacific Island language at home (31% well, 69% not well).
Foreign born population: 120 (2.5%) (69.0% of them are naturalized citizens)
This zip code:
2.5%
Whole state:
12.7%
32%Poland
17%Honduras
14%France
10%Thailand
8%Australia
5%Greece
36%German
24%American
6%English
6%Irish
5%Italian
2%French Canadian
2%Scottish
Year of entry for the foreign-born population
82010 or later
212000 to 2009
751990 to 1999
39Before 1990
Facilities with environmental interests located in this zip code:
7-ELEVEN #18245 (285 WEST OLD CROSS ROAD in NEW MARKET, VA)
Small Quantity Generators, between 100 kg and 1000 kg of hazardous waste/month (Resource Conservation and Recovery Act (tracking hazardous waste)) - notification Organizations: OPERNAME (CONTACT/OPERATOR)
, SOUTHLAND CORPORATION THE (CONTACT/OWNER)
BEAR RIDGE FARM (234 BRANNERTOWN LANE in NEW MARKET, VA)
AIR MINOR (AIRS/AFS) Business SIC classification: TURKEYS AND TURKEY EGGS
211 BODY SHOP P & USED CARS (RT 211 EAST in NEW MARKET, VA)
Conditionally Exempt Small Quantity Generators, less than 100 kg/month of hazardous waste (Resource Conservation and Recovery Act (tracking hazardous waste)) - notification Organizations: RAYMOND E OVEBAUGH (CONTACT/OWNER)
ADAMS CONSTRUCTION COMPANY (615 LIMESTONE RD in NEW MARKET, VA)
AIR SYNTHETIC MINOR (AIRS/AFS) Business SIC classification: ASPHALT PAVING MIXTURES AND BLOCKS
Housing units lacking complete plumbing facilities: 0.6% Housing units lacking complete kitchen facilities: 2.2%
63.2%Electricity
16.2%Fuel oil, kerosene, etc.
12.8%Utility gas
5.0%Wood
2.7%Bottled, tank, or LP gas
Population in 1990: 3,502. Population change in the 1990s: +485 (+13.8%).
Place of birth for U.S.-born residents:
This state: 3,011
Northeast: 459
Midwest: 202
South: 685
West: 219
52% of the 22844 zip code residents lived in the same house 5 years ago. Out of people who lived in different houses, 36% lived in this county. Out of people who lived in different counties, 50% lived in Virginia.
88% of the 22844 zip code residents lived in the same house 1 year ago. Out of people who lived in different houses, 27% moved from this county. Out of people who lived in different houses, 66% moved from different county within same state. Out of people who lived in different houses, 7% moved from different state.
Private vs. public school enrollment:
Students in private schools in grades 1 to 8 (elementary and middle school): 48
Here:
17.2%
Virginia:
13.2%
Students in private schools in grades 9 to 12 (high school): 15
Here:
9.9%
Virginia:
10.2%
Students in private undergraduate colleges: 21
Here:
20.9%
Virginia:
18.7%
Occupation by median earnings in the past 12 months ($)
88,978Health diagnosing and treating practitioners and other technical occupations
83,766Business and financial operations occupations
80,013Computer and mathematical occupations
67,735Installation, maintenance, and repair occupations
59,118Transportation occupations
57,049Management occupations
Top industries in this zip code by the number of employees in 2005:
Health Care and Social Assistance: Nursing Care Facilities (100-249 employees: 1 establishment)
Educational Services: Elementary and Secondary Schools (100-249: 1)
Accommodation and Food Services: Hotels (except Casino Hotels) and Motels (50-99: 1, 20-49: 1, 5-9: 1, 1-4: 1)
Accommodation and Food Services: Limited-Service Restaurants (20-49: 2)
Detailed PMIC statistics for the following Tracts:0104.00
2004 - 2018 National Fire Incident Reporting System (NFIRS) incidents
Based on the data from the years 2004 - 2018 the average number of fires per year is 30. The highest number of fires - 58 took place in 2007, and the least - 11 in 2010. The data has a declining trend.
When looking into fire subcategories, the most incidents belonged to: Structure Fires (49.1%), and Outside Fires (23.4%).
Fire incident types reported to NFIRS in Zip Code 22844


 Nearest zip codes: 22847, 22853, 22842, 22849, 22851, 22824.


 Based on the data from the years 2004 - 2018 the average number of fires per year is 30. The highest number of fires - 58 took place in 2007, and the least - 11 in 2010. The data has a declining trend.
 When looking into fire subcategories, the most incidents belonged to: Structure Fires (49.1%), and Outside Fires (23.4%).