Estimated zip code population in 2022: 7,001 Zip code population in 2010: 7,046 Zip code population in 2000: 6,262
Houses and condos: 2,921 Renter-occupied apartments: 594
% of renters here:
22%
State:
33%
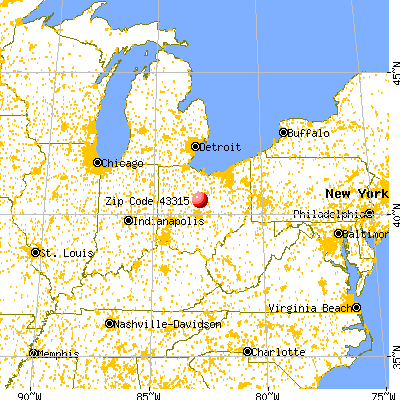
March 2022 cost of living index in zip code 43315: 83.5 (less than average, U.S. average is 100)
Land area: 81.0 sq. mi. Water area: 0.0 sq. mi.
Population density: 86 people per square mile
(very low).
OSM Map
General Map
Google Map
MSN Map
OSM Map
General Map
Google Map
MSN Map
OSM Map
General Map
Google Map
MSN Map
OSM Map
General Map
Google Map
MSN Map
Please wait while loading the map...
Real estate property taxes paid for housing units in 2022:
This zip code:
1.0% ($1,801)
Ohio:
1.3% ($2,639)
Median real estate property taxes paid for housing units with mortgages in 2022: $2,013 (1.1%) Median real estate property taxes paid for housing units with no mortgage in 2022: $1,443 (1.1%)
Estimated median house/condo value in 2022: $173,702
43315:
$173,702
Ohio:
$204,100
According to our research of Ohio and other state lists, there were 13 registered sex offenders living in 43315 zip code as of June 16, 2024. The ratio of all residents to sex offenders in zip code 43315 is 546 to 1. The ratio of registered sex offenders to all residents in this zip code is near the state average.
Median resident age:
This zip code:
46.0 years
Ohio median age:
39.9 years
Average household size:
This zip code:
2.6 people
Ohio:
2.4 people
Averages for the 2020 tax year for zip code 43315, filed in 2021:
Average Adjusted Gross Income (AGI) in 2020: $55,287 (Individual Income Tax Returns)
Here:
$55,287
State:
$67,288
Salary/wage: $49,747 (reported on 84.3% of returns)
Here:
$49,747
State:
$55,628
(% of AGI for various income ranges: 1170.4% for AGIs below $25k, 3613.5% for AGIs $25k-50k, 6748.7% for AGIs $50k-75k, 9700.8% for AGIs $75k-100k, 16493.0% for AGIs $100k-200k)
Taxable interest for individuals: $564 (reported on 22.0% of returns)
This zip code:
$564
Ohio:
$1,518
(% of AGI for various income ranges: 7.6% for AGIs below $25k, 6.3% for AGIs $25k-50k, 17.3% for AGIs $50k-75k, 9.6% for AGIs $75k-100k, 27.0% for AGIs $100k-200k)
Ordinary dividends: $2,619 (reported on 12.2% of returns)
Here:
$2,619
State:
$7,167
(% of AGI for various income ranges: 9.7% for AGIs below $25k, 17.9% for AGIs $25k-50k, 57.6% for AGIs $50k-75k, 54.8% for AGIs $75k-100k, 105.2% for AGIs $100k-200k)
Net capital gain/loss in AGI: +$10,805 (reported on 11.0% of returns)
Here:
+$10,805
State:
+$18,919
(% of AGI for various income ranges: 12.4% for AGIs below $25k, 30.5% for AGIs $25k-50k, 54.9% for AGIs $50k-75k, 139.6% for AGIs $75k-100k, 364.8% for AGIs $100k-200k)
Profit/loss from business: +$8,878 (reported on 14.5% of returns)
Here:
+$8,878
State:
+$13,744
(% of AGI for various income ranges: 121.7% for AGIs below $25k, 133.7% for AGIs $25k-50k, 142.2% for AGIs $50k-75k, 252.4% for AGIs $75k-100k, 448.9% for AGIs $100k-200k)
Taxable individual retirement arrangement distribution: $12,056 (reported on 7.8% of returns)
43315:
$12,056
Ohio:
$18,876
(% of AGI for various income ranges: 52.1% for AGIs below $25k, 92.9% for AGIs $25k-50k, 226.2% for AGIs $50k-75k, 197.6% for AGIs $75k-100k, 232.2% for AGIs $100k-200k)
Total itemized deductions: $24,464 (reported on 3.2% of returns)
Here:
$24,464
State:
$33,869
(% of AGI for various income ranges: 64.9% for AGIs below $25k, 129.3% for AGIs $50k-75k, 186.0% for AGIs $75k-100k, 428.5% for AGIs $100k-200k)
Charity contributions: $7,075 (reported on 2.3% of returns)
Here:
$7,075
State:
$14,577
(% of AGI for various income ranges: 43.8% for AGIs $50k-75k, 136.7% for AGIs $100k-200k)
Taxes paid: $6,300 (reported on 3.2% of returns)
43315:
$6,300
State:
$7,681
(% of AGI for various income ranges: 7.7% for AGIs below $25k, 28.2% for AGIs $50k-75k, 53.2% for AGIs $75k-100k, 138.9% for AGIs $100k-200k)
Earned income credit: $2,011 (reported on 15.4% of returns)
Here:
$2,011
State:
$2,304
(% of AGI for various income ranges: 92.7% for AGIs below $25k, 47.6% for AGIs $25k-50k)
Percentage of individuals using paid preparers for their 2020 taxes: 95.7%
Here:
96%
State:
94%
(% for various income ranges: 94.1% for AGIs below $25k, 95.9% for AGIs $25k-50k, 96.8% for AGIs $50k-75k, 97.1% for AGIs $75k-100k, 97.6% for AGIs $100k-200k, 83.3% for AGIs over 200k)
Averages for the 2012 tax year for zip code 43315, filed in 2013:
Average Adjusted Gross Income (AGI) in 2012: $44,671 (Individual Income Tax Returns)
Here:
$44,671
State:
$54,926
Salary/wage: $40,152 (reported on 86.1% of returns)
Here:
$40,152
State:
$45,869
(% of AGI for various income ranges: 73.4% for AGIs below $25k, 81.4% for AGIs $25k-50k, 82.9% for AGIs $50k-75k, 81.4% for AGIs $75k-100k, 74.9% for AGIs $100k-200k, 53.2% for AGIs over 200k)
Taxable interest for individuals: $714 (reported on 22.9% of returns)
This zip code:
$714
Ohio:
$1,297
(% of AGI for various income ranges: 0.4% for AGIs below $25k, 0.4% for AGIs $25k-50k, 0.5% for AGIs $50k-75k, 0.1% for AGIs $75k-100k, 0.4% for AGIs $100k-200k, 0.2% for AGIs over 200k)
Ordinary dividends: $1,779 (reported on 11.8% of returns)
Here:
$1,779
State:
$5,821
(% of AGI for various income ranges: 0.6% for AGIs below $25k, 0.5% for AGIs $25k-50k, 0.2% for AGIs $50k-75k, 0.6% for AGIs $75k-100k, 0.8% for AGIs $100k-200k)
Net capital gain/loss in AGI: +$4,828 (reported on 7.7% of returns)
Here:
+$4,828
State:
+$11,232
(% of AGI for various income ranges: 0.9% for AGIs $50k-75k, 3.2% for AGIs $100k-200k)
Profit/loss from business: +$7,483 (reported on 16.4% of returns)
Here:
+$7,483
State:
+$12,773
(% of AGI for various income ranges: 8.7% for AGIs below $25k, 2.9% for AGIs $25k-50k, 1.6% for AGIs $50k-75k, 1.0% for AGIs $75k-100k, 3.2% for AGIs $100k-200k)
Taxable individual retirement arrangement distribution: $10,136 (reported on 7.7% of returns)
43315:
$10,136
Ohio:
$14,511
(% of AGI for various income ranges: 2.5% for AGIs below $25k, 1.6% for AGIs $25k-50k, 1.1% for AGIs $50k-75k, 2.0% for AGIs $75k-100k, 2.8% for AGIs $100k-200k)
Total itemized deductions: $16,370 (19% of AGI, reported on 24.8% of returns)
Here:
$16,370
State:
$21,278
Here:
19.5% of AGI
State:
18.8% of AGI
(% of AGI for various income ranges: 5.8% for AGIs below $25k, 6.4% for AGIs $25k-50k, 9.8% for AGIs $50k-75k, 12.0% for AGIs $75k-100k, 11.7% for AGIs $100k-200k, 7.4% for AGIs over 200k)
Charity contributions: $2,704 (reported on 17.6% of returns)
Here:
$2,704
State:
$3,943
(% of AGI for various income ranges: 0.3% for AGIs below $25k, 0.6% for AGIs $25k-50k, 1.2% for AGIs $50k-75k, 1.6% for AGIs $75k-100k, 1.7% for AGIs $100k-200k, 0.5% for AGIs over 200k)
Taxes paid: $5,990 (reported on 24.8% of returns)
43315:
$5,990
State:
$9,568
(% of AGI for various income ranges: 0.9% for AGIs below $25k, 1.7% for AGIs $25k-50k, 3.0% for AGIs $50k-75k, 4.4% for AGIs $75k-100k, 5.2% for AGIs $100k-200k, 5.4% for AGIs over 200k)
Earned income credit: $2,234 (reported on 20.7% of returns)
Here:
$2,234
State:
$2,285
(% of AGI for various income ranges: 7.2% for AGIs below $25k, 1.1% for AGIs $25k-50k)
Percentage of individuals using paid preparers for their 2012 taxes: 53.6%
Here:
54%
State:
51%
(% for various income ranges: 48.4% for AGIs below $25k, 55.2% for AGIs $25k-50k, 56.0% for AGIs $50k-75k, 55.6% for AGIs $75k-100k, 60.9% for AGIs $100k-200k, 100.0% for AGIs over 200k)
Averages for the 2004 tax year for zip code 43315, filed in 2005:
Average Adjusted Gross Income (AGI) in 2004: $36,638 (Individual Income Tax Returns)
Here:
$36,638
State:
$44,480
Salary/wage: $34,496 (reported on 89.3% of returns)
Here:
$34,496
State:
$39,198
(% of AGI for various income ranges: 95.4% for AGIs below $10k, 78.4% for AGIs $10k-25k, 87.8% for AGIs $25k-50k, 87.6% for AGIs $50k-75k, 86.8% for AGIs $75k-100k, 69.5% for AGIs over 100k)
Taxable interest for individuals: $754 (reported on 34.5% of returns)
This zip code:
$754
Ohio:
$1,532
(% of AGI for various income ranges: 2.2% for AGIs below $10k, 1.7% for AGIs $10k-25k, 0.5% for AGIs $25k-50k, 0.8% for AGIs $50k-75k, 0.4% for AGIs $75k-100k, 0.4% for AGIs over 100k)
Taxable dividends: $1,133 (reported on 14.8% of returns)
Here:
$1,133
State:
$3,496
(% of AGI for various income ranges: 1.5% for AGIs below $10k, 0.5% for AGIs $10k-25k, 0.3% for AGIs $25k-50k, 0.3% for AGIs $50k-75k, 0.5% for AGIs $75k-100k, 0.8% for AGIs over 100k)
Net capital gain/loss: +$4,003 (reported on 9.3% of returns)
Here:
+$4,003
State:
+$8,582
(% of AGI for various income ranges: 1.3% for AGIs below $10k, 0.3% for AGIs $10k-25k, 0.5% for AGIs $25k-50k, 0.9% for AGIs $50k-75k, 1.5% for AGIs $75k-100k, 2.4% for AGIs over 100k)
Profit/loss from business: +$7,293 (reported on 16.7% of returns)
Here:
+$7,293
State:
+$10,813
(% of AGI for various income ranges: 8.4% for AGIs below $10k, 6.0% for AGIs $10k-25k, 2.9% for AGIs $25k-50k, 1.9% for AGIs $50k-75k, 2.9% for AGIs $75k-100k, 4.2% for AGIs over 100k)
IRA payment deduction: $2,154 (reported on 1.2% of returns)
43315:
$2,154
Ohio:
$2,794
Total itemized deductions: $13,941 (23% of AGI, reported on 31.3% of returns)
Here:
$13,941
State:
$17,503
Here:
23.1% of AGI
State:
20.8% of AGI
(% of AGI for various income ranges: 11.0% for AGIs below $10k, 7.8% for AGIs $10k-25k, 10.2% for AGIs $25k-50k, 13.3% for AGIs $50k-75k, 15.1% for AGIs $75k-100k, 13.4% for AGIs over 100k)
Charity contributions deductions: $1,942 (3% of AGI, reported on 22.2% of returns)
Here:
$1,942
State:
$3,087
Here:
3.0% of AGI
State:
3.4% of AGI
(% of AGI for various income ranges: 0.9% for AGIs below $10k, 0.7% for AGIs $10k-25k, 0.7% for AGIs $25k-50k, 1.5% for AGIs $50k-75k, 1.5% for AGIs $75k-100k, 1.8% for AGIs over 100k)
Total tax: $4,156 (reported on 76.7% of returns)
43315:
$4,156
State:
$6,781
(% of AGI for various income ranges: 3.9% for AGIs below $10k, 4.3% for AGIs $10k-25k, 6.8% for AGIs $25k-50k, 8.0% for AGIs $50k-75k, 10.1% for AGIs $75k-100k, 16.9% for AGIs over 100k)
Earned income credit: $1,663 (reported on 15.8% of returns)
Here:
$1,663
State:
$1,696
Percentage of individuals using paid preparers for their 2004 taxes: 56.1%
Here:
56%
State:
55%
(% for various income ranges: 47.3% for AGIs below $10k, 56.4% for AGIs $10k-25k, 59.6% for AGIs $25k-50k, 55.0% for AGIs $50k-75k, 57.7% for AGIs $75k-100k, 70.9% for AGIs over 100k)
Likely homosexual households (counted as self-reported same-sex unmarried-partner households)
Lesbian couples: 0.1% of all households
Gay men: 0.4% of all households
Household received Food Stamps/SNAP in the past 12 months: 384 Household did not receive Food Stamps/SNAP in the past 12 months: 2,334
Women who had a birth in the past 12 months: 138 (50 now married, 85 unmarried) Women who did not have a birth in the past 12 months: 1,282 (590 now married, 691 unmarried)
Housing units in zip code 43315 with a mortgage: 1,237 (95 second mortgage, 97 both second mortgage and home equity loan) Houses without a mortgage: 31
Median monthly owner costs for units with a mortgage: $1,352 Median monthly owner costs for units without a mortgage: $495
Residents with income below the poverty level in 2022:
This zip code:
8.2%
Whole state:
13.4%
Residents with income below 50% of the poverty level in 2022:
This zip code:
4.3%
Whole state:
7.0%
Median number of rooms in houses and condos:
Here:
6.4
State:
6.7
Median number of rooms in apartments:
Here:
5.6
State:
4.4
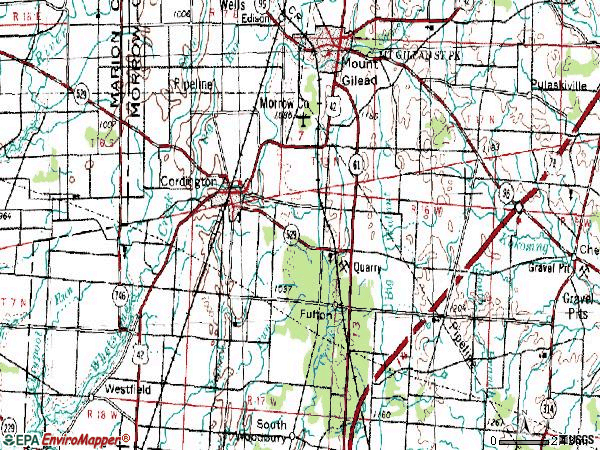
Notable locations in this zip code not listed on our city pages
Notable locations in zip code 43315: Penlan (A), Camp Wheeler (B), Shoemaker Farms (C), Cardington Fire Department (D). Display/hide their locations on the map
Churches in zip code 43315 include: Bethel Church (A), Brookside Chapel (B), Center Church (C), Chester Baptist Church (D), Mount Pisgah Church (E), Saint Johns Church (F), Harmony Church (G), Saint Paul Evangelical Lutheran Church (H). Display/hide their locations on the map
Cemeteries: Asbury Cemetery (1), Baldwin Cemetery (2), Shawtown Cemetery (3), Buck Cemetery (4), Baptist Cemetery (5), Glendale Cemetery (6), Weston Cemetery (7). Display/hide their locations on the map
Streams, rivers, and creeks: Mud Run (A), Mitchell Run (B), Big Run (C), Shaw Creek (D), South Branch Kokosing River (E). Display/hide their locations on the map
In group quarters: 33 (-1 institutionalized population)
Size of family households: 1,018 2-persons, 526 3-persons, 311 4-persons, 149 5-persons, 34 6-persons, 15 7-or-more-persons
Size of nonfamily households: 589 1-person, 60 2-persons
680 married couples with children.
397 single-parent households (86 men, 311 women).
98.4% of residents of 43315 zip code speak English at home.
0.1% of residents speak Spanish at home (100% well).
1.1% of residents speak other Indo-European language at home (100% very well).
Foreign born population: 45 (0.6%) (100.0% of them are naturalized citizens)
This zip code:
0.6%
Whole state:
5.0%
26%American
18%German
13%Irish
8%English
5%Italian
3%Polish
2%Scotch-Irish
Year of entry for the foreign-born population
22010 or later
02000 to 2009
01990 to 1999
49Before 1990
Facilities with environmental interests located in this zip code:
CARDINGTON WWTP (REICHELDERFER ST in CARDINGTON, OH)
STATE MASTER (Ohio general info) - PCS-OH0023361, National Pollutant Discharge Elimination System Permit National Pollutant Discharge Elimination System NON-MAJOR (Tracking pollutant discharge elimination systems) - permit National Pollutant Discharge Elimination System NON-MAJOR (Tracking pollutant discharge elimination systems) - permit Business SIC classification: SEWERAGE SYSTEMS Organizations: VILLAGE OF CARDINGTON (CONTACT/OWNER)
Alternative names: CARDINGTON, VILLAGE OF, VILLAGE OF CARDINGTON
CARDINGTON YUTAKA TECHNOLOGIES (575 W. MAIN ST. in CARDINGTON, OH)
CRITERIA AND HAZARDOUS AIR POLLUTANT INVENTORY (Inventory of air pollution sources) STATE MASTER (Ohio general info) - AIR MAJOR, EPCRA, TRIS-43315CRDNG575WM, TRI REPORTER, RCRA-OHR000013979, HAZARDOUS WASTE PROGRAM Small Quantity Generators, between 100 kg and 1000 kg of hazardous waste/month (Resource Conservation and Recovery Act (tracking hazardous waste)) - notification TRI REPORTER (Tracking of toxic chemicals releasing facilities) Business SIC classification: MOTOR VEHICLE PARTS AND ACCESSORIES Organizations: CARDINGTON LYUTAKA TECHNOLOGIES (CONTACT/OWNER)
CARDINGTON DUCHESS (101 GILEAD ST in CARDINGTON, OH)
STATE MASTER (Ohio general info) - -59-5541-1058-A, EPCRA, RCRA-OHR000029397, HAZARDOUS WASTE PROGRAM Small Quantity Generators, between 100 kg and 1000 kg of hazardous waste/month (Resource Conservation and Recovery Act (tracking hazardous waste)) - notification Organizations: ENGLEFIELD OIL CO (CONTACT/OWNER)
CARDINGTON LOCAL DIGITAL (121 NICHOLS ST in CARDINGTON, OH)
(National Center for Education Statistics) - STATE ID-151076
CARDINGTON-LINCOLN ELEMENTARY (121 NICHOLS ST in CARDINGTON, OH)
(National Center for Education Statistics) - STATE ID-004879 Organizations: CARDINGTON-LINCOLN LOCAL SD (SCHOOL DISTRICT)
CARDINGTON-LINCOLN HIGH SCHOO (349 CHESTERVILLE AVE in CARDINGTON, OH)
(National Center for Education Statistics) - STATE ID-004861 Organizations: CARDINGTON-LINCOLN LOCAL SD (SCHOOL DISTRICT)
CARDINGTON-LINCOLN MIDDLE SCH (349 CHESTERVILLE AVE in CARDINGTON, OH)
(National Center for Education Statistics) - STATE ID-110007 Organizations: CARDINGTON-LINCOLN LOCAL SD (SCHOOL DISTRICT)
CARDINGTON LINCOLN LOCAL SD (349 CHESTERVILLE AVE in CARDINGTON, OH)
COMPLIANCE ACTIVITY (Tracking inspections of insecticide, fungicide, and rodenticide, and toxic substances) Alternative names: CARDINGTON LINCOLN LOCAL SCHOOL DIST
Housing units lacking complete plumbing facilities: 1.7% Housing units lacking complete kitchen facilities: 3.4%
36.5%Bottled, tank, or LP gas
25.2%Utility gas
18.8%Electricity
12.0%Wood
4.1%No fuel used
1.9%Fuel oil, kerosene, etc.
1.7%Other fuel
Population in 1990: 4,739. Population change in the 1990s: +1,523 (+32.1%).
Place of birth for U.S.-born residents:
This state: 5,896
Northeast: 77
Midwest: 324
South: 525
West: 106
53% of the 43315 zip code residents lived in the same house 5 years ago. Out of people who lived in different houses, 45% lived in this county. Out of people who lived in different counties, 50% lived in Ohio.
95% of the 43315 zip code residents lived in the same house 1 year ago. Out of people who lived in different houses, 68% moved from this county. Out of people who lived in different houses, 33% moved from different county within same state. Out of people who lived in different houses, 5% moved from different state.
Private vs. public school enrollment:
Students in private schools in grades 1 to 8 (elementary and middle school): 21
Here:
4.8%
Ohio:
16.0%
Students in private schools in grades 9 to 12 (high school): 17
Here:
4.3%
Ohio:
13.1%
Students in private undergraduate colleges: 6
Here:
3.9%
Ohio:
22.3%
Occupation by median earnings in the past 12 months ($)
88,158Health technologists and technicians
78,098Health diagnosing and treating practitioners and other technical occupations
72,816Arts, design, entertainment, sports, and media occupations
68,741Management occupations
64,789Installation, maintenance, and repair occupations
48,391Production occupations
Top industries in this zip code by the number of employees in 2005:
Accommodation and Food Services: Full-Service Restaurants (20-49 employees: 1 establishment)
Other Services (except Public Administration): Religious Organizations (10-19: 1, 5-9: 1, 1-4: 4)
Construction: New Single-Family Housing Construction (except Operative Builders) (5-9: 3, 1-4: 4)
Construction: Plumbing, Heating, and Air-Conditioning Contractors (10-19: 1, 5-9: 1)
Construction: Masonry Contractors (5-9: 3)
Accommodation and Food Services: Limited-Service Restaurants (10-19: 1, 1-4: 2)
Construction: Site Preparation Contractors (10-19: 1)
People in group quarters in 2010:
31 people in group homes intended for adults
Fatal accident statistics in 2013:
Fatal accident count: 2
Vehicles involved in fatal accidents: 4
Fatal accidents caused by drunken drivers: 0
Fatalities: 2
Persons involved in fatal accidents: 5
Pedestrians involved in fatal accidents: 0
Fatal accident statistics in 2011:
Fatal accident count: 3
Vehicles involved in fatal accidents: 5
Fatal accidents caused by drunken drivers: 0
Fatalities: 3
Persons involved in fatal accidents: 5
Pedestrians involved in fatal accidents: 0
Home Mortgage Disclosure Act Aggregated Statistics For Year 2009 (Based on 4 partial tracts)
A) FHA, FSA/RHS & VA Home Purchase Loans
B) Conventional Home Purchase Loans
C) Refinancings
D) Home Improvement Loans
F) Non-occupant Loans on < 5 Family Dwellings (A B C & D)
G) Loans On Manufactured Home Dwelling (A B C & D)
Number
Average Value
Number
Average Value
Number
Average Value
Number
Average Value
Number
Average Value
Number
Average Value
LOANS ORIGINATED
47
$109,410
26
$126,485
152
$128,473
11
$27,273
5
$88,380
21
$81,476
APPLICATIONS APPROVED, NOT ACCEPTED
2
$226,470
2
$63,435
15
$128,392
0
$0
0
$0
0
$0
APPLICATIONS DENIED
10
$87,151
16
$92,375
89
$123,482
7
$12,047
2
$59,905
12
$81,932
APPLICATIONS WITHDRAWN
7
$133,376
2
$59,955
32
$128,584
1
$36,380
2
$153,230
0
$0
FILES CLOSED FOR INCOMPLETENESS
1
$141,170
0
$0
10
$99,878
1
$240,140
1
$106,240
1
$240,140
Aggregated Statistics For Year 2008 (Based on 4 partial tracts)
A) FHA, FSA/RHS & VA Home Purchase Loans
B) Conventional Home Purchase Loans
C) Refinancings
D) Home Improvement Loans
F) Non-occupant Loans on < 5 Family Dwellings (A B C & D)
G) Loans On Manufactured Home Dwelling (A B C & D)
Number
Average Value
Number
Average Value
Number
Average Value
Number
Average Value
Number
Average Value
Number
Average Value
LOANS ORIGINATED
51
$111,578
36
$104,606
87
$123,110
30
$27,751
13
$67,405
26
$83,619
APPLICATIONS APPROVED, NOT ACCEPTED
0
$0
10
$100,889
17
$110,237
7
$13,991
0
$0
1
$28,500
APPLICATIONS DENIED
11
$120,115
16
$63,637
115
$124,233
24
$44,951
3
$117,283
16
$99,795
APPLICATIONS WITHDRAWN
3
$126,950
1
$53,690
40
$132,937
3
$70,640
2
$74,795
3
$118,117
FILES CLOSED FOR INCOMPLETENESS
0
$0
0
$0
3
$104,637
0
$0
0
$0
0
$0
Aggregated Statistics For Year 2007 (Based on 4 partial tracts)
A) FHA, FSA/RHS & VA Home Purchase Loans
B) Conventional Home Purchase Loans
C) Refinancings
D) Home Improvement Loans
F) Non-occupant Loans on < 5 Family Dwellings (A B C & D)
G) Loans On Manufactured Home Dwelling (A B C & D)
Number
Average Value
Number
Average Value
Number
Average Value
Number
Average Value
Number
Average Value
Number
Average Value
LOANS ORIGINATED
31
$117,292
80
$131,232
145
$122,712
48
$41,814
26
$104,560
28
$111,141
APPLICATIONS APPROVED, NOT ACCEPTED
0
$0
17
$73,576
33
$107,851
4
$12,945
4
$129,333
5
$95,944
APPLICATIONS DENIED
2
$62,935
42
$88,975
145
$116,848
42
$45,364
13
$97,812
22
$74,355
APPLICATIONS WITHDRAWN
1
$126,380
15
$101,129
58
$108,307
2
$64,840
0
$0
2
$25,735
FILES CLOSED FOR INCOMPLETENESS
0
$0
4
$111,230
12
$111,954
2
$22,320
0
$0
0
$0
Aggregated Statistics For Year 2006 (Based on 4 partial tracts)
A) FHA, FSA/RHS & VA Home Purchase Loans
B) Conventional Home Purchase Loans
C) Refinancings
D) Home Improvement Loans
F) Non-occupant Loans on < 5 Family Dwellings (A B C & D)
G) Loans On Manufactured Home Dwelling (A B C & D)
Number
Average Value
Number
Average Value
Number
Average Value
Number
Average Value
Number
Average Value
Number
Average Value
LOANS ORIGINATED
32
$132,582
131
$106,382
206
$107,640
37
$39,052
26
$100,231
52
$80,992
APPLICATIONS APPROVED, NOT ACCEPTED
5
$101,708
13
$69,098
39
$99,166
3
$77,477
5
$52,044
7
$57,771
APPLICATIONS DENIED
10
$127,784
48
$90,376
213
$108,447
36
$51,876
7
$129,366
34
$73,989
APPLICATIONS WITHDRAWN
4
$90,892
18
$102,903
82
$112,950
5
$116,042
1
$148,680
5
$106,080
FILES CLOSED FOR INCOMPLETENESS
0
$0
7
$107,623
26
$134,096
0
$0
0
$0
0
$0
Aggregated Statistics For Year 2005 (Based on 4 partial tracts)
A) FHA, FSA/RHS & VA Home Purchase Loans
B) Conventional Home Purchase Loans
C) Refinancings
D) Home Improvement Loans
F) Non-occupant Loans on < 5 Family Dwellings (A B C & D)
G) Loans On Manufactured Home Dwelling (A B C & D)
Number
Average Value
Number
Average Value
Number
Average Value
Number
Average Value
Number
Average Value
Number
Average Value
LOANS ORIGINATED
34
$127,018
123
$103,912
263
$103,117
38
$52,022
22
$74,509
39
$89,273
APPLICATIONS APPROVED, NOT ACCEPTED
1
$158,640
22
$112,533
62
$107,403
6
$37,345
3
$65,013
12
$59,995
APPLICATIONS DENIED
9
$95,990
73
$85,661
259
$116,569
38
$67,639
10
$67,259
56
$79,599
APPLICATIONS WITHDRAWN
0
$0
25
$93,179
152
$124,359
9
$144,208
3
$158,553
11
$95,949
FILES CLOSED FOR INCOMPLETENESS
0
$0
3
$95,817
28
$148,244
2
$66,590
0
$0
1
$145,540
Aggregated Statistics For Year 2004 (Based on 4 partial tracts)
A) FHA, FSA/RHS & VA Home Purchase Loans
B) Conventional Home Purchase Loans
C) Refinancings
D) Home Improvement Loans
F) Non-occupant Loans on < 5 Family Dwellings (A B C & D)
G) Loans On Manufactured Home Dwelling (A B C & D)
Detailed PMIC statistics for the following Tracts:9853.00
, 9854.00
2002 - 2018 National Fire Incident Reporting System (NFIRS) incidents
According to the data from the years 2002 - 2018 the average number of fire incidents per year is 44. The highest number of fire incidents - 62 took place in 2003, and the least - 27 in 2005. The data has a growing trend.
When looking into fire subcategories, the most reports belonged to: Structure Fires (57.8%), and Outside Fires (25.3%).
Fire incident types reported to NFIRS in Zip Code 43315


 Nearest zip codes: 43321, 43320, 43334, 43003, 43338, 43356.


 According to the data from the years 2002 - 2018 the average number of fire incidents per year is 44. The highest number of fire incidents - 62 took place in 2003, and the least - 27 in 2005. The data has a growing trend.
 When looking into fire subcategories, the most reports belonged to: Structure Fires (57.8%), and Outside Fires (25.3%).