Estimated zip code population in 2022: 1,575 Zip code population in 2010: 1,691 Zip code population in 2000: 1,465
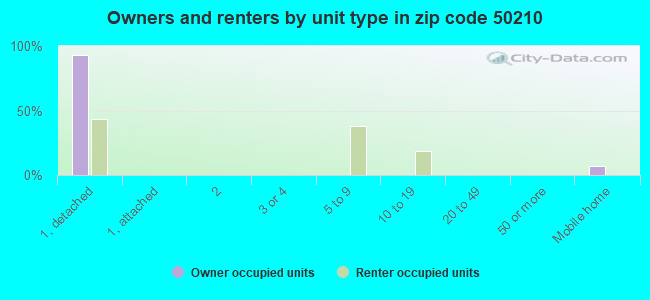
Houses and condos: 626 Renter-occupied apartments: 60
% of renters here:
10%
State:
28%
March 2022 cost of living index in zip code 50210: 84.6 (less than average, U.S. average is 100)
Land area: 75.8 sq. mi. Water area: 0.1 sq. mi.
Population density: 21 people per square mile
(very low).
OSM Map
General Map
Google Map
MSN Map
OSM Map
General Map
Google Map
MSN Map
OSM Map
General Map
Google Map
MSN Map
OSM Map
General Map
Google Map
MSN Map
Please wait while loading the map...
Real estate property taxes paid for housing units in 2022:
This zip code:
1.0% ($2,863)
Iowa:
1.4% ($2,724)
Median real estate property taxes paid for housing units with mortgages in 2022: $3,082 (1.0%) Median real estate property taxes paid for housing units with no mortgage in 2022: $2,670 (1.0%)
Business Search- 14 Million verified businesses
Males: 865
(54.9%)
Females: 710
(45.1%)
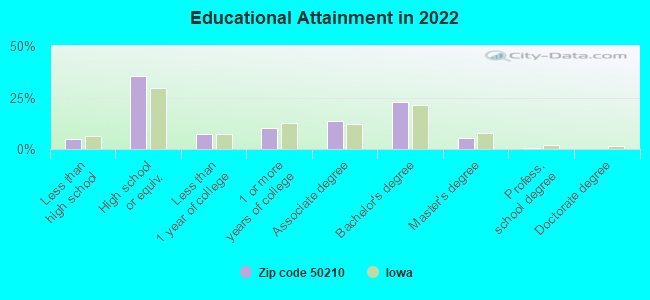
For population 25 years and over in 50210:
High school or higher: 94.7%
Bachelor's degree or higher: 28.7%
Graduate or professional degree: 6.0%
Unemployed: 2.9%
Mean travel time to work (commute): 38.4 minutes
For population 15 years and over in 50210:
Never married: 16.4%
Now married: 66.4%
Separated: 0.7%
Widowed: 8.2%
Divorced: 8.2%
Zip code 50210 compared to state average:
Median house value above state average.
Black race population percentage significantly below state average.
Foreign-born population percentage significantly below state average.
Renting percentage significantly below state average.
Estimated median house/condo value in 2022: $295,329
50210:
$295,329
Iowa:
$194,600
According to our research of Iowa and other state lists, there were 3 registered sex offenders living in 50210 zip code as of June 16, 2024. The ratio of all residents to sex offenders in zip code 50210 is 552 to 1. The ratio of registered sex offenders to all residents in this zip code is near the state average.
Median resident age:
This zip code:
41.0 years
Iowa median age:
38.9 years
Average household size:
This zip code:
2.5 people
Iowa:
2.3 people
Averages for the 2020 tax year for zip code 50210, filed in 2021:
Average Adjusted Gross Income (AGI) in 2020: $73,541 (Individual Income Tax Returns)
Here:
$73,541
State:
$71,087
Salary/wage: $67,870 (reported on 79.5% of returns)
Here:
$67,870
State:
$57,361
(% of AGI for various income ranges: 1052.9% for AGIs below $25k, 3316.7% for AGIs $25k-50k, 6671.1% for AGIs $50k-75k, 9980.0% for AGIs $75k-100k, 15197.7% for AGIs $100k-200k)
Taxable interest for individuals: $1,021 (reported on 41.0% of returns)
This zip code:
$1,021
Iowa:
$1,633
(% of AGI for various income ranges: 35.7% for AGIs below $25k, 36.7% for AGIs $25k-50k, 76.7% for AGIs $50k-75k, 58.8% for AGIs $75k-100k, 84.6% for AGIs $100k-200k)
Ordinary dividends: $2,194 (reported on 20.5% of returns)
Here:
$2,194
State:
$5,432
(% of AGI for various income ranges: 40.7% for AGIs below $25k, 65.0% for AGIs $25k-50k, 62.2% for AGIs $50k-75k, 106.2% for AGIs $75k-100k, 74.6% for AGIs $100k-200k)
Net capital gain/loss in AGI: +$7,113 (reported on 18.1% of returns)
Here:
+$7,113
State:
+$15,243
(% of AGI for various income ranges: 2.9% for AGIs below $25k, 62.5% for AGIs $25k-50k, 71.2% for AGIs $75k-100k, 716.2% for AGIs $100k-200k)
Profit/loss from business: +$13,750 (reported on 16.9% of returns)
Here:
+$13,750
State:
+$11,763
(% of AGI for various income ranges: 164.3% for AGIs below $25k, 655.0% for AGIs $25k-50k, 427.5% for AGIs $75k-100k, 436.2% for AGIs $100k-200k)
Taxable individual retirement arrangement distribution: $18,244 (reported on 10.8% of returns)
50210:
$18,244
Iowa:
$17,324
(% of AGI for various income ranges: 314.2% for AGIs $25k-50k, 695.6% for AGIs $50k-75k, 491.5% for AGIs $100k-200k)
Total itemized deductions: $28,617 (reported on 7.2% of returns)
Here:
$28,617
State:
$33,775
(% of AGI for various income ranges: 935.6% for AGIs $50k-75k, 673.1% for AGIs $100k-200k)
Charity contributions: $3,700 (reported on 4.8% of returns)
Here:
$3,700
State:
$13,075
(% of AGI for various income ranges: 185.0% for AGIs $75k-100k)
Taxes paid: $7,483 (reported on 7.2% of returns)
50210:
$7,483
State:
$7,704
(% of AGI for various income ranges: 203.3% for AGIs $50k-75k, 204.6% for AGIs $100k-200k)
Earned income credit: $2,600 (reported on 7.2% of returns)
Here:
$2,600
State:
$2,195
(% of AGI for various income ranges: 67.1% for AGIs below $25k, 51.7% for AGIs $25k-50k)
Percentage of individuals using paid preparers for their 2020 taxes: 97.6%
Here:
98%
State:
95%
(% for various income ranges: 100.0% for AGIs below $25k, 100.0% for AGIs $25k-50k, 92.9% for AGIs $50k-75k, 100.0% for AGIs $75k-100k, 94.7% for AGIs $100k-200k, 100.0% for AGIs over 200k)
Averages for the 2012 tax year for zip code 50210, filed in 2013:
Average Adjusted Gross Income (AGI) in 2012: $56,325 (Individual Income Tax Returns)
Here:
$56,325
State:
$58,860
Salary/wage: $49,462 (reported on 82.5% of returns)
Here:
$49,462
State:
$46,659
(% of AGI for various income ranges: 68.1% for AGIs below $25k, 75.5% for AGIs $25k-50k, 73.5% for AGIs $50k-75k, 80.8% for AGIs $75k-100k, 66.5% for AGIs $100k-200k)
Taxable interest for individuals: $846 (reported on 32.5% of returns)
This zip code:
$846
Iowa:
$1,537
(% of AGI for various income ranges: 1.8% for AGIs below $25k, 0.7% for AGIs $25k-50k, 0.4% for AGIs $50k-75k, 0.3% for AGIs $75k-100k, 0.3% for AGIs $100k-200k)
Ordinary dividends: $1,607 (reported on 17.5% of returns)
Here:
$1,607
State:
$4,542
(% of AGI for various income ranges: 0.5% for AGIs below $25k, 0.4% for AGIs $25k-50k, 0.4% for AGIs $50k-75k, 0.9% for AGIs $75k-100k, 0.4% for AGIs $100k-200k)
Net capital gain/loss in AGI: +$3,325 (reported on 15.0% of returns)
Here:
+$3,325
State:
+$11,802
(% of AGI for various income ranges: 0.4% for AGIs $25k-50k, 1.1% for AGIs $50k-75k, 0.4% for AGIs $75k-100k, 1.4% for AGIs $100k-200k)
Profit/loss from business: +$10,393 (reported on 17.5% of returns)
Here:
+$10,393
State:
+$10,509
(% of AGI for various income ranges: 6.4% for AGIs below $25k, 6.2% for AGIs $25k-50k, 4.2% for AGIs $50k-75k, 4.6% for AGIs $75k-100k)
Taxable individual retirement arrangement distribution: $12,467 (reported on 11.2% of returns)
50210:
$12,467
Iowa:
$11,773
(% of AGI for various income ranges: 5.0% for AGIs below $25k, 6.0% for AGIs $25k-50k, 5.7% for AGIs $75k-100k)
Total itemized deductions: $18,552 (21% of AGI, reported on 36.2% of returns)
Here:
$18,552
State:
$21,278
Here:
21.0% of AGI
State:
18.9% of AGI
(% of AGI for various income ranges: 11.4% for AGIs below $25k, 12.7% for AGIs $25k-50k, 12.6% for AGIs $50k-75k, 12.0% for AGIs $75k-100k, 11.3% for AGIs $100k-200k)
Charity contributions: $2,035 (reported on 25.0% of returns)
Here:
$2,035
State:
$4,044
(% of AGI for various income ranges: 2.1% for AGIs $25k-50k, 0.7% for AGIs $50k-75k, 0.7% for AGIs $75k-100k, 0.8% for AGIs $100k-200k)
Taxes paid: $6,686 (reported on 36.2% of returns)
50210:
$6,686
State:
$8,846
(% of AGI for various income ranges: 1.9% for AGIs below $25k, 3.0% for AGIs $25k-50k, 3.7% for AGIs $50k-75k, 4.5% for AGIs $75k-100k, 5.5% for AGIs $100k-200k)
Earned income credit: $2,078 (reported on 11.2% of returns)
Here:
$2,078
State:
$2,098
(% of AGI for various income ranges: 4.3% for AGIs below $25k, 0.7% for AGIs $25k-50k)
Percentage of individuals using paid preparers for their 2012 taxes: 68.8%
Here:
69%
State:
65%
(% for various income ranges: 61.5% for AGIs below $25k, 66.7% for AGIs $25k-50k, 73.3% for AGIs $50k-75k, 72.7% for AGIs $75k-100k, 80.0% for AGIs $100k-200k)
Averages for the 2004 tax year for zip code 50210, filed in 2005:
Average Adjusted Gross Income (AGI) in 2004: $41,718 (Individual Income Tax Returns)
Here:
$41,718
State:
$43,875
Salary/wage: $42,196 (reported on 84.6% of returns)
Here:
$42,196
State:
$38,265
(% of AGI for various income ranges: 115.1% for AGIs below $10k, 62.5% for AGIs $10k-25k, 82.3% for AGIs $25k-50k, 90.8% for AGIs $50k-75k, 90.4% for AGIs $75k-100k, 85.1% for AGIs over 100k)
Taxable interest for individuals: $1,088 (reported on 48.9% of returns)
This zip code:
$1,088
Iowa:
$1,768
(% of AGI for various income ranges: 6.9% for AGIs below $10k, 4.5% for AGIs $10k-25k, 1.7% for AGIs $25k-50k, 0.7% for AGIs $50k-75k, 0.5% for AGIs $75k-100k, 0.3% for AGIs over 100k)
Taxable dividends: $1,063 (reported on 22.7% of returns)
Here:
$1,063
State:
$2,510
(% of AGI for various income ranges: 1.3% for AGIs below $10k, 2.8% for AGIs $10k-25k, 0.7% for AGIs $25k-50k, 0.1% for AGIs $50k-75k, 0.3% for AGIs $75k-100k, 0.1% for AGIs over 100k)
Net capital gain/loss: +$4,149 (reported on 23.6% of returns)
Here:
+$4,149
State:
+$6,139
(% of AGI for various income ranges: 1.1% for AGIs below $10k, 2.7% for AGIs $10k-25k, 1.5% for AGIs $25k-50k, 0.7% for AGIs $50k-75k, 1.0% for AGIs $75k-100k, 10.0% for AGIs over 100k)
Profit/loss from business: +$5,292 (reported on 17.9% of returns)
Here:
+$5,292
State:
+$8,574
(% of AGI for various income ranges: 2.9% for AGIs below $10k, 9.9% for AGIs $10k-25k, 4.6% for AGIs $25k-50k, 0.9% for AGIs $50k-75k, -0.5% for AGIs $75k-100k)
IRA payment deduction: $2,963 (reported on 3.5% of returns)
50210:
$2,963
Iowa:
$2,970
Total itemized deductions: $14,421 (23% of AGI, reported on 38.1% of returns)
Here:
$14,421
State:
$16,976
Here:
23.0% of AGI
State:
20.8% of AGI
(% of AGI for various income ranges: 9.0% for AGIs $10k-25k, 12.0% for AGIs $25k-50k, 13.1% for AGIs $50k-75k, 15.7% for AGIs $75k-100k, 15.7% for AGIs over 100k)
Charity contributions deductions: $1,443 (2% of AGI, reported on 30.0% of returns)
Here:
$1,443
State:
$3,089
Here:
2.2% of AGI
State:
3.6% of AGI
(% of AGI for various income ranges: 0.5% for AGIs $10k-25k, 1.5% for AGIs $25k-50k, 0.9% for AGIs $50k-75k, 1.0% for AGIs $75k-100k, 1.0% for AGIs over 100k)
Total tax: $4,392 (reported on 81.2% of returns)
50210:
$4,392
State:
$6,177
(% of AGI for various income ranges: 4.0% for AGIs below $10k, 5.0% for AGIs $10k-25k, 6.7% for AGIs $25k-50k, 8.9% for AGIs $50k-75k, 9.2% for AGIs $75k-100k, 13.1% for AGIs over 100k)
Earned income credit: $1,750 (reported on 8.3% of returns)
Here:
$1,750
State:
$1,540
Percentage of individuals using paid preparers for their 2004 taxes: 77.6%
Here:
78%
State:
70%
(% for various income ranges: 67.6% for AGIs below $10k, 76.3% for AGIs $10k-25k, 80.5% for AGIs $25k-50k, 79.1% for AGIs $50k-75k, 85.3% for AGIs $75k-100k, 73.5% for AGIs over 100k)
Likely homosexual households (counted as self-reported same-sex unmarried-partner households)
Lesbian couples: 0.0% of all households
Gay men: 2.0% of all households
Household received Food Stamps/SNAP in the past 12 months: 5 Household did not receive Food Stamps/SNAP in the past 12 months: 629
Women who had a birth in the past 12 months: 32 (25 now married, 7 unmarried) Women who did not have a birth in the past 12 months: 294 (200 now married, 93 unmarried)
Housing units in zip code 50210 with a mortgage: 370 (20 second mortgage, 2 home equity loan, 18 both second mortgage and home equity loan) Houses without a mortgage: 7
Median monthly owner costs for units with a mortgage: $1,836 Median monthly owner costs for units without a mortgage: $600
Residents with income below the poverty level in 2022:
This zip code:
5.6%
Whole state:
11.0%
Residents with income below 50% of the poverty level in 2022:
This zip code:
1.1%
Whole state:
5.5%
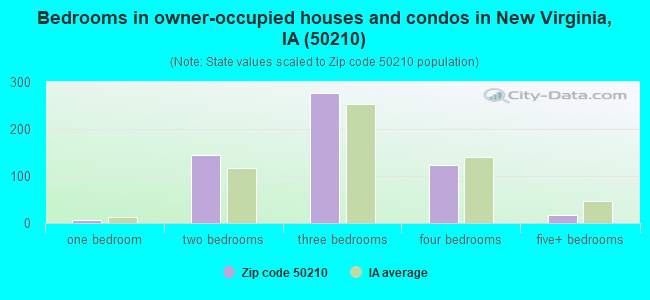
Median number of rooms in houses and condos:
Here:
6.3
State:
6.8
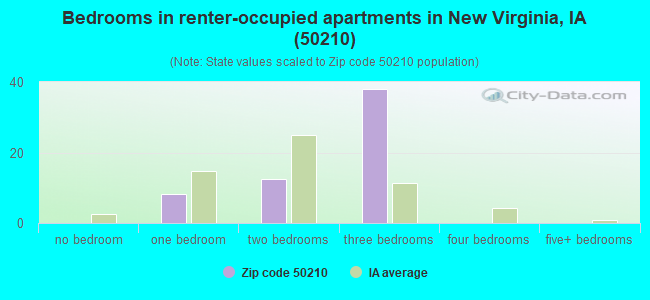
Median number of rooms in apartments:
Here:
6.3
State:
4.2
Notable locations in this zip code not listed on our city pages
Churches in zip code 50210 include: Fremont Church (A), Medford Church (B), Mount Tabor Church (C), Grace Baptist Church (D), New Virginia Christian Church (E), Broadhorn Church (F), New Virginia United Methodist Church (G). Display/hide their locations on the map
Cemeteries: Fremont Cemetery (1), Jamison Cemetery (2), Rhodes Cemetery (3), Mount Tabor Cemetery (4), Beymer Cemetery (5), Green Cemetery (6). Display/hide their locations on the map
Creeks: Broadhorn Creek (A), Skinaway Creek (B), Limestone Creek (C), Papoose Creek (D), Box Elder Creek (E), Walnut Creek (F). Display/hide their locations on the map
Parks in zip code 50210 include: Hickory Hills County Park (1), Rolling Thunder Prairie (2), Green Pines Wildlife Area (3). Display/hide their locations on the map
Size of family households: 227 2-persons, 52 3-persons, 89 4-persons, 24 5-persons, 21 6-persons, 24 7-or-more-persons
Size of nonfamily households: 165 1-person, 23 2-persons
357 married couples with children.
44 single-parent households (25 men, 19 women).
97.8% of residents of 50210 zip code speak English at home.
2.2% of residents speak Spanish at home (100% very well).
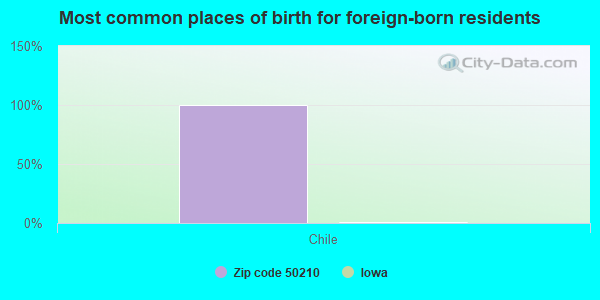
Foreign born population: 8 (0.6%) (100.0% of them are naturalized citizens)
This zip code:
0.6%
Whole state:
6.0%
100%Chile
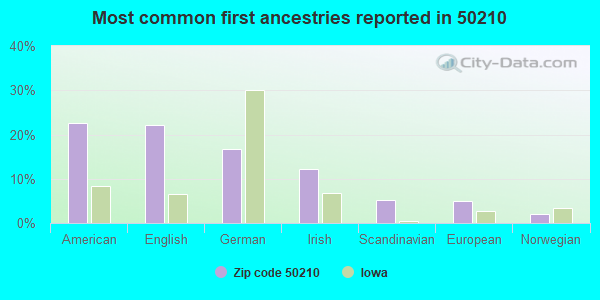
23%American
22%English
17%German
12%Irish
5%Scandinavian
5%European
2%Norwegian
Year of entry for the foreign-born population
02010 or later
02000 to 2009
01990 to 1999
7Before 1990
Facilities with environmental interests located in this zip code:
SEED & GRAIN SYSTEMS INCORPORATED (2131 20TH AVENUE in NEW VIRGINIA, IA)
(Resource Conservation and Recovery Act (tracking hazardous waste)) Business NAICS classification: FARM MACHINERY AND EQUIPMENT MANUFACTURING. Organizations: FREDERICK ENTERPRISES, INC. (CONTACT/OWNER)
NEW VIRGINIA SANITARY DISTRICT C/O CHERYL BOLES (811 WEST STREET in NEW VIRGINIA, IA)
National Pollutant Discharge Elimination System NON-MAJOR (Tracking pollutant discharge elimination systems) - permit Business SIC classification: SEWERAGE SYSTEMS
REED IMPLEMENT INC-FORMER SITE OF (212 WEST ST in NEW VIRGINIA, IA)
(Resource Conservation and Recovery Act (tracking hazardous waste)) Organizations: JAMES D REED (CONTACT/OWNER)
NEW VIRGINIAN-FORMER SITE OF (400 WEST ST in NEW VIRGINIA, IA)
(Resource Conservation and Recovery Act (tracking hazardous waste))
REED'S INTERSTATE SALES CENTER (147 HWY 207 in NEW VIRGINIA, IA)
(Resource Conservation and Recovery Act (tracking hazardous waste))
AEC ENTERPRISES (2131 20TH AVENUE in NEW VIRGINIA, IA)
AIR SYNTHETIC MINOR (AIRS/AFS) Business SIC classification: FARM MACHINERY AND EQUIPMENT
NATHAN TAYLOR (3261 WOODBROOK LANE in NEW VIRGINIA, IA)
COMPLIANCE ACTIVITY (Tracking inspections of insecticide, fungicide, and rodenticide, and toxic substances)
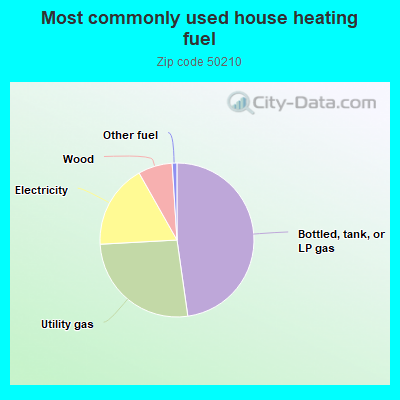
47.8%Bottled, tank, or LP gas
26.4%Utility gas
17.7%Electricity
7.2%Wood
1.0%Other fuel
Population in 1990: 1,593.
Place of birth for U.S.-born residents:
This state: 1,223
Northeast: 12
Midwest: 119
South: 84
West: 127
61% of the 50210 zip code residents lived in the same house 5 years ago. Out of people who lived in different houses, 36% lived in this county. Out of people who lived in different counties, 50% lived in Iowa.
98% of the 50210 zip code residents lived in the same house 1 year ago. Out of people who lived in different houses, 79% moved from different county within same state. Out of people who lived in different houses, 11% moved from different state. Out of people who lived in different houses, 37% moved from abroad.
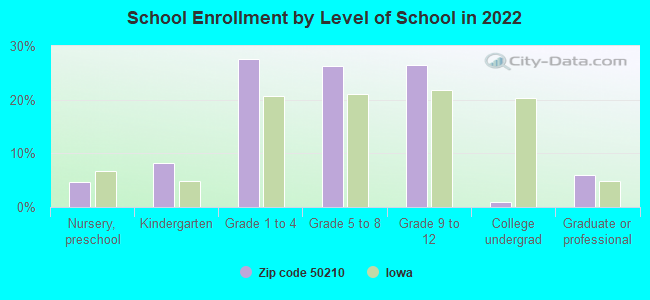
Private vs. public school enrollment:
Students in private schools in grades 1 to 8 (elementary and middle school): 16
Here:
7.2%
Iowa:
10.6%
Students in private schools in grades 9 to 12 (high school): 3
Here:
2.8%
Iowa:
7.9%
Students in private undergraduate colleges:
Here:
0.0%
Iowa:
23.9%
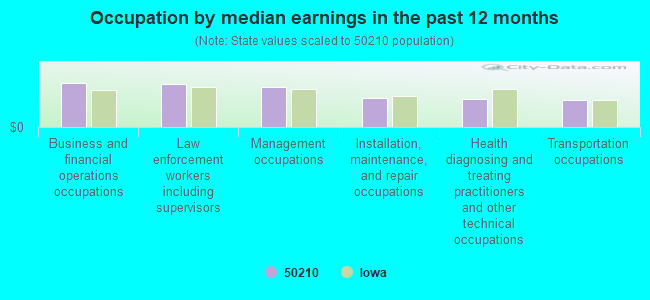
Occupation by median earnings in the past 12 months ($)
100,635Business and financial operations occupations
98,362Law enforcement workers including supervisors
90,446Management occupations
66,650Installation, maintenance, and repair occupations
63,687Health diagnosing and treating practitioners and other technical occupations
62,659Transportation occupations
Top industries in this zip code by the number of employees in 2005:
Construction: New Single-Family Housing Construction (except Operative Builders) (10-19 employees: 1 establishment)
Construction: Commercial and Institutional Building Construction (10-19: 1)
Finance and Insurance: Commercial Banking (10-19: 1)
Information: Libraries and Archives (5-9: 1)
Other Services (except Public Administration): All Other Automotive Repair and Maintenance (5-9: 1)
Administrative and Support and Waste Management and Remediation Services: Landscaping Services (1-4: 2)
Other Services (except Public Administration): Religious Organizations (1-4: 2)
Construction: Plumbing, Heating, and Air-Conditioning Contractors (1-4: 1)
Fatal accident statistics in 2012:
Fatal accident count: 2
Vehicles involved in fatal accidents: 2
Fatal accidents caused by drunken drivers: 0
Fatalities: 2
Persons involved in fatal accidents: 2
Pedestrians involved in fatal accidents: 0
Home Mortgage Disclosure Act Aggregated Statistics For Year 2009 (Based on 2 partial tracts)
A) FHA, FSA/RHS & VA Home Purchase Loans
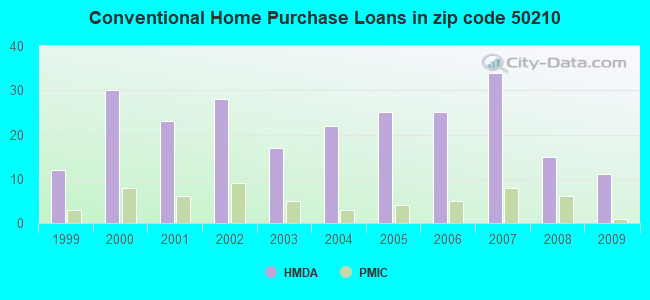
B) Conventional Home Purchase Loans
C) Refinancings
D) Home Improvement Loans
F) Non-occupant Loans on < 5 Family Dwellings (A B C & D)
G) Loans On Manufactured Home Dwelling (A B C & D)
Number
Average Value
Number
Average Value
Number
Average Value
Number
Average Value
Number
Average Value
Number
Average Value
LOANS ORIGINATED
9
$150,633
11
$127,625
71
$170,019
5
$89,366
6
$71,303
1
$14,580
APPLICATIONS APPROVED, NOT ACCEPTED
1
$174,300
1
$342,890
10
$120,042
0
$0
1
$55,770
1
$83,660
APPLICATIONS DENIED
1
$216,130
0
$0
18
$162,992
2
$33,590
0
$0
1
$59,580
APPLICATIONS WITHDRAWN
0
$0
1
$228,170
11
$154,014
1
$106,480
1
$121,060
0
$0
FILES CLOSED FOR INCOMPLETENESS
1
$74,790
0
$0
3
$166,477
0
$0
0
$0
0
$0
Aggregated Statistics For Year 2008 (Based on 2 partial tracts)
A) FHA, FSA/RHS & VA Home Purchase Loans
B) Conventional Home Purchase Loans
C) Refinancings
D) Home Improvement Loans
E) Loans on Dwellings For 5+ Families
F) Non-occupant Loans on < 5 Family Dwellings (A B C & D)
G) Loans On Manufactured Home Dwelling (A B C & D)
Number
Average Value
Number
Average Value
Number
Average Value
Number
Average Value
Number
Average Value
Number
Average Value
Number
Average Value
LOANS ORIGINATED
3
$159,930
15
$144,507
41
$136,329
8
$51,021
1
$51,340
6
$84,402
1
$124,220
APPLICATIONS APPROVED, NOT ACCEPTED
0
$0
1
$207,890
6
$224,893
2
$24,400
0
$0
1
$147,680
0
$0
APPLICATIONS DENIED
1
$59,580
3
$106,690
23
$139,353
8
$56,646
0
$0
1
$78,590
2
$156,865
APPLICATIONS WITHDRAWN
0
$0
4
$257,005
8
$174,216
1
$159,720
0
$0
1
$291,550
0
$0
FILES CLOSED FOR INCOMPLETENESS
1
$149,580
2
$82,075
5
$174,676
1
$9,510
0
$0
0
$0
0
$0
Aggregated Statistics For Year 2007 (Based on 2 partial tracts)
A) FHA, FSA/RHS & VA Home Purchase Loans
B) Conventional Home Purchase Loans
C) Refinancings
D) Home Improvement Loans
F) Non-occupant Loans on < 5 Family Dwellings (A B C & D)
G) Loans On Manufactured Home Dwelling (A B C & D)
Number
Average Value
Number
Average Value
Number
Average Value
Number
Average Value
Number
Average Value
Number
Average Value
LOANS ORIGINATED
1
$192,680
34
$164,136
44
$135,504
11
$58,483
4
$157,658
3
$98,450
APPLICATIONS APPROVED, NOT ACCEPTED
1
$46,270
3
$472,180
15
$120,464
2
$17,745
1
$86,200
0
$0
APPLICATIONS DENIED
1
$59,580
5
$104,958
24
$209,048
3
$35,070
0
$0
0
$0
APPLICATIONS WITHDRAWN
0
$0
3
$138,590
10
$140,133
3
$75,843
0
$0
0
$0
FILES CLOSED FOR INCOMPLETENESS
0
$0
2
$130,245
6
$144,507
0
$0
0
$0
0
$0
Aggregated Statistics For Year 2006 (Based on 2 partial tracts)
A) FHA, FSA/RHS & VA Home Purchase Loans
B) Conventional Home Purchase Loans
C) Refinancings
D) Home Improvement Loans
E) Loans on Dwellings For 5+ Families
F) Non-occupant Loans on < 5 Family Dwellings (A B C & D)
G) Loans On Manufactured Home Dwelling (A B C & D)
Number
Average Value
Number
Average Value
Number
Average Value
Number
Average Value
Number
Average Value
Number
Average Value
Number
Average Value
LOANS ORIGINATED
1
$110,280
25
$115,757
51
$110,617
10
$33,275
1
$5,070
5
$107,746
4
$55,932
APPLICATIONS APPROVED, NOT ACCEPTED
1
$60,840
6
$141,337
11
$136,209
0
$0
0
$0
1
$26,620
0
$0
APPLICATIONS DENIED
1
$95,700
4
$122,640
28
$143,986
3
$50,493
0
$0
2
$111,550
1
$144,510
APPLICATIONS WITHDRAWN
0
$0
5
$94,436
12
$119,682
1
$63,380
0
$0
1
$26,620
0
$0
FILES CLOSED FOR INCOMPLETENESS
0
$0
1
$95,070
8
$93,802
0
$0
0
$0
0
$0
0
$0
Aggregated Statistics For Year 2005 (Based on 2 partial tracts)
A) FHA, FSA/RHS & VA Home Purchase Loans
B) Conventional Home Purchase Loans
C) Refinancings
D) Home Improvement Loans
E) Loans on Dwellings For 5+ Families
F) Non-occupant Loans on < 5 Family Dwellings (A B C & D)
G) Loans On Manufactured Home Dwelling (A B C & D)
Number
Average Value
Number
Average Value
Number
Average Value
Number
Average Value
Number
Average Value
Number
Average Value
Number
Average Value
LOANS ORIGINATED
1
$160,990
25
$113,044
58
$115,057
13
$24,767
1
$65,920
6
$81,443
0
$0
APPLICATIONS APPROVED, NOT ACCEPTED
0
$0
4
$111,390
16
$116,223
1
$114,080
0
$0
1
$57,040
0
$0
APPLICATIONS DENIED
0
$0
5
$133,606
42
$122,459
4
$33,115
0
$0
2
$38,345
1
$99,510
APPLICATIONS WITHDRAWN
0
$0
2
$132,145
15
$138,380
1
$25,350
0
$0
0
$0
1
$273,800
FILES CLOSED FOR INCOMPLETENESS
0
$0
2
$200,915
10
$153,506
1
$70,350
0
$0
0
$0
0
$0
Aggregated Statistics For Year 2004 (Based on 2 partial tracts)
A) FHA, FSA/RHS & VA Home Purchase Loans
B) Conventional Home Purchase Loans
C) Refinancings
D) Home Improvement Loans
F) Non-occupant Loans on < 5 Family Dwellings (A B C & D)
G) Loans On Manufactured Home Dwelling (A B C & D)
Number
Average Value
Number
Average Value
Number
Average Value
Number
Average Value
Number
Average Value
Number
Average Value
LOANS ORIGINATED
1
$166,060
22
$109,763
56
$101,261
10
$37,521
4
$124,382
1
$114,720
APPLICATIONS APPROVED, NOT ACCEPTED
0
$0
5
$83,916
8
$65,122
0
$0
1
$31,690
1
$24,080
APPLICATIONS DENIED
1
$112,180
6
$94,013
26
$100,360
6
$25,563
1
$59,580
1
$44,370
APPLICATIONS WITHDRAWN
0
$0
7
$64,467
16
$110,479
0
$0
3
$71,197
1
$62,750
FILES CLOSED FOR INCOMPLETENESS
0
$0
2
$91,265
4
$144,030
1
$30,420
0
$0
0
$0
Aggregated Statistics For Year 2003 (Based on 2 partial tracts)
A) FHA, FSA/RHS & VA Home Purchase Loans
B) Conventional Home Purchase Loans
C) Refinancings
D) Home Improvement Loans
E) Loans on Dwellings For 5+ Families
F) Non-occupant Loans on < 5 Family Dwellings (A B C & D)
Number
Average Value
Number
Average Value
Number
Average Value
Number
Average Value
Number
Average Value
Number
Average Value
LOANS ORIGINATED
2
$91,585
17
$110,803
100
$111,010
13
$23,645
1
$15,850
4
$68,768
APPLICATIONS APPROVED, NOT ACCEPTED
0
$0
4
$97,288
11
$108,092
1
$57,040
0
$0
0
$0
APPLICATIONS DENIED
0
$0
4
$90,950
43
$122,147
7
$26,167
1
$215,490
1
$84,300
APPLICATIONS WITHDRAWN
0
$0
6
$52,817
18
$112,641
0
$0
0
$0
1
$60,210
FILES CLOSED FOR INCOMPLETENESS
0
$0
3
$78,380
8
$112,738
0
$0
0
$0
1
$38,030
Aggregated Statistics For Year 2002 (Based on 2 partial tracts)
A) FHA, FSA/RHS & VA Home Purchase Loans
B) Conventional Home Purchase Loans
C) Refinancings
D) Home Improvement Loans
F) Non-occupant Loans on < 5 Family Dwellings (A B C & D)
Number
Average Value
Number
Average Value
Number
Average Value
Number
Average Value
Number
Average Value
LOANS ORIGINATED
5
$95,704
28
$126,851
93
$112,292
10
$24,655
4
$68,610
APPLICATIONS APPROVED, NOT ACCEPTED
0
$0
4
$121,372
20
$89,682
2
$10,775
0
$0
APPLICATIONS DENIED
0
$0
7
$95,523
23
$121,111
2
$17,745
0
$0
APPLICATIONS WITHDRAWN
1
$80,490
4
$112,340
18
$92,957
1
$15,850
0
$0
FILES CLOSED FOR INCOMPLETENESS
0
$0
3
$82,183
8
$138,485
0
$0
0
$0
Aggregated Statistics For Year 2001 (Based on 2 partial tracts)
A) FHA, FSA/RHS & VA Home Purchase Loans
B) Conventional Home Purchase Loans
C) Refinancings
D) Home Improvement Loans
F) Non-occupant Loans on < 5 Family Dwellings (A B C & D)
Number
Average Value
Number
Average Value
Number
Average Value
Number
Average Value
Number
Average Value
LOANS ORIGINATED
5
$98,240
23
$127,587
71
$95,329
7
$24,537
1
$60,840
APPLICATIONS APPROVED, NOT ACCEPTED
0
$0
3
$143,240
10
$105,654
1
$9,510
1
$85,560
APPLICATIONS DENIED
2
$90,635
6
$113,238
30
$91,922
4
$19,648
1
$3,800
APPLICATIONS WITHDRAWN
1
$74,790
2
$84,930
13
$75,520
1
$15,850
0
$0
FILES CLOSED FOR INCOMPLETENESS
0
$0
0
$0
3
$143,027
1
$38,030
0
$0
Aggregated Statistics For Year 2000 (Based on 2 partial tracts)
A) FHA, FSA/RHS & VA Home Purchase Loans
B) Conventional Home Purchase Loans
C) Refinancings
D) Home Improvement Loans
E) Loans on Dwellings For 5+ Families
F) Non-occupant Loans on < 5 Family Dwellings (A B C & D)
Number
Average Value
Number
Average Value
Number
Average Value
Number
Average Value
Number
Average Value
Number
Average Value
LOANS ORIGINATED
3
$91,480
30
$108,676
35
$72,362
13
$21,549
1
$67,180
2
$154,965
APPLICATIONS APPROVED, NOT ACCEPTED
0
$0
4
$69,242
8
$71,144
2
$12,040
0
$0
1
$15,850
APPLICATIONS DENIED
1
$43,730
10
$65,725
18
$67,429
7
$27,163
0
$0
1
$92,530
APPLICATIONS WITHDRAWN
0
$0
4
$62,745
4
$103,785
2
$22,185
0
$0
1
$14,580
FILES CLOSED FOR INCOMPLETENESS
0
$0
1
$92,530
6
$117,253
0
$0
0
$0
0
$0
Aggregated Statistics For Year 1999 (Based on 1 partial tract)
A) FHA, FSA/RHS & VA Home Purchase Loans
B) Conventional Home Purchase Loans
C) Refinancings
D) Home Improvement Loans
F) Non-occupant Loans on < 5 Family Dwellings (A B C & D)

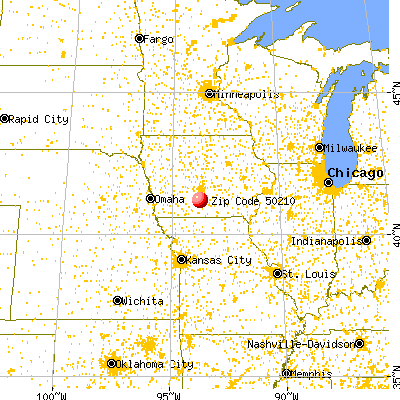


 Nearest zip codes: 50240, 50257, 50213, 50125, 50160, 50275.